

Perpetuation of Privilege
Debunking the U.S. News Best Colleges Lists
It's the news drop heard around the world. Every fall, U.S. News releases its rankings of top colleges in the United States, and millions flock to the site (more than 10 million in the first 72 hours after publishing in 2007 (Chartier and Peachey, 2014)).
High school students and their parents rely heavily on the rankings to help them make the expensive and life-impacting decision of where to apply, and ultimately attend, college. One college senior recalled his time researching colleges, saying:
Parents and students look at the [U.S. News] rankings and assume they [U.S. News] did their research and know what they're talking about, so we don't have to.
Universities collectively spend billions of dollars and countless hours toward improving their rankings — resources that could be directed toward student-benefiting programs.
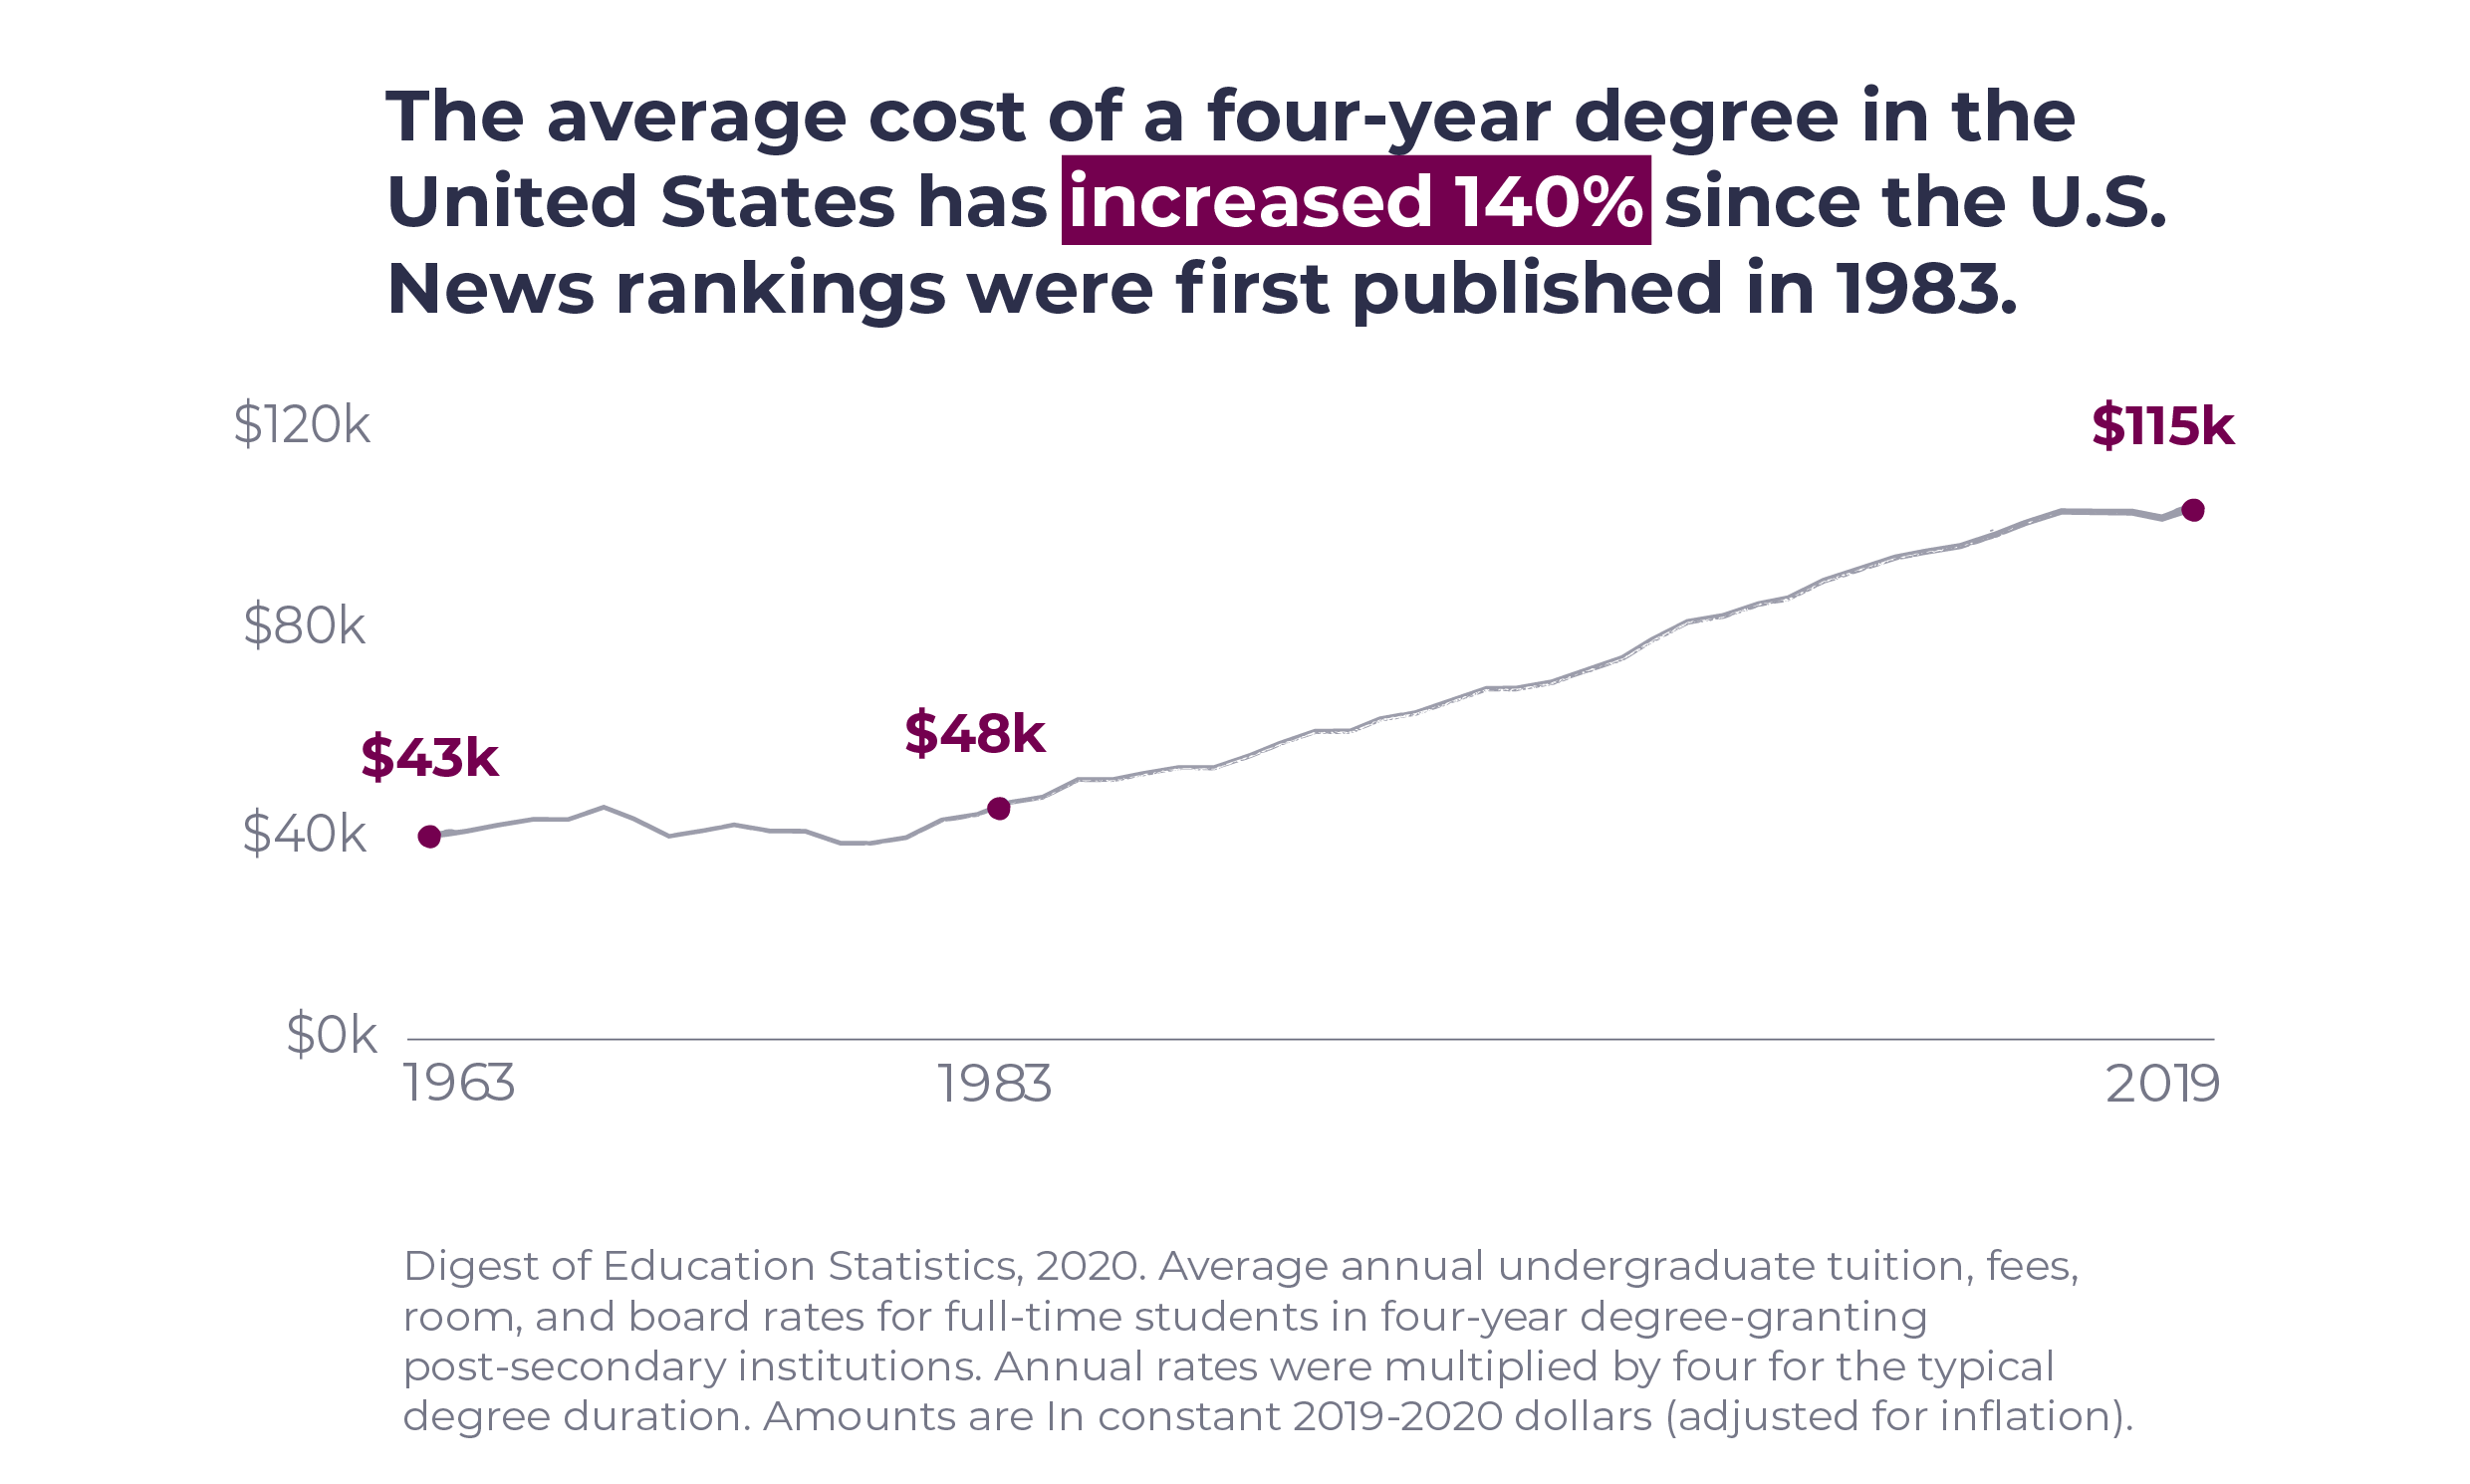
The cost of college education has increased 140% since the U.S. News Best Colleges rankings were first published in 1983, with student loan debt reaching an all-time high of $1.75 trillion in 2021, outpacing the growth of the U.S. economy six times over (Hanson, 2021).
Following the COVID-19 global pandemic, during which many college students were forced into virtual learning environments, the education industry is facing serious disruption. Students and parents alike are questioning the value of their investment. Universities must justify the high price tags and consider how costly practices, like vying for placement on the U.S. News rankings, not only contribute to higher student costs and indebtedness, but also prop up questionable reporting practices.
In theory the U.S. News Best Colleges rankings measure the quality of academic instruction and experience.
But is U.S. News measuring what students care about? And how accurate and reliable is the U.S. News analysis?
Digging into the history and the calculations underlying the rankings, however, calls into question the value of the rankings.
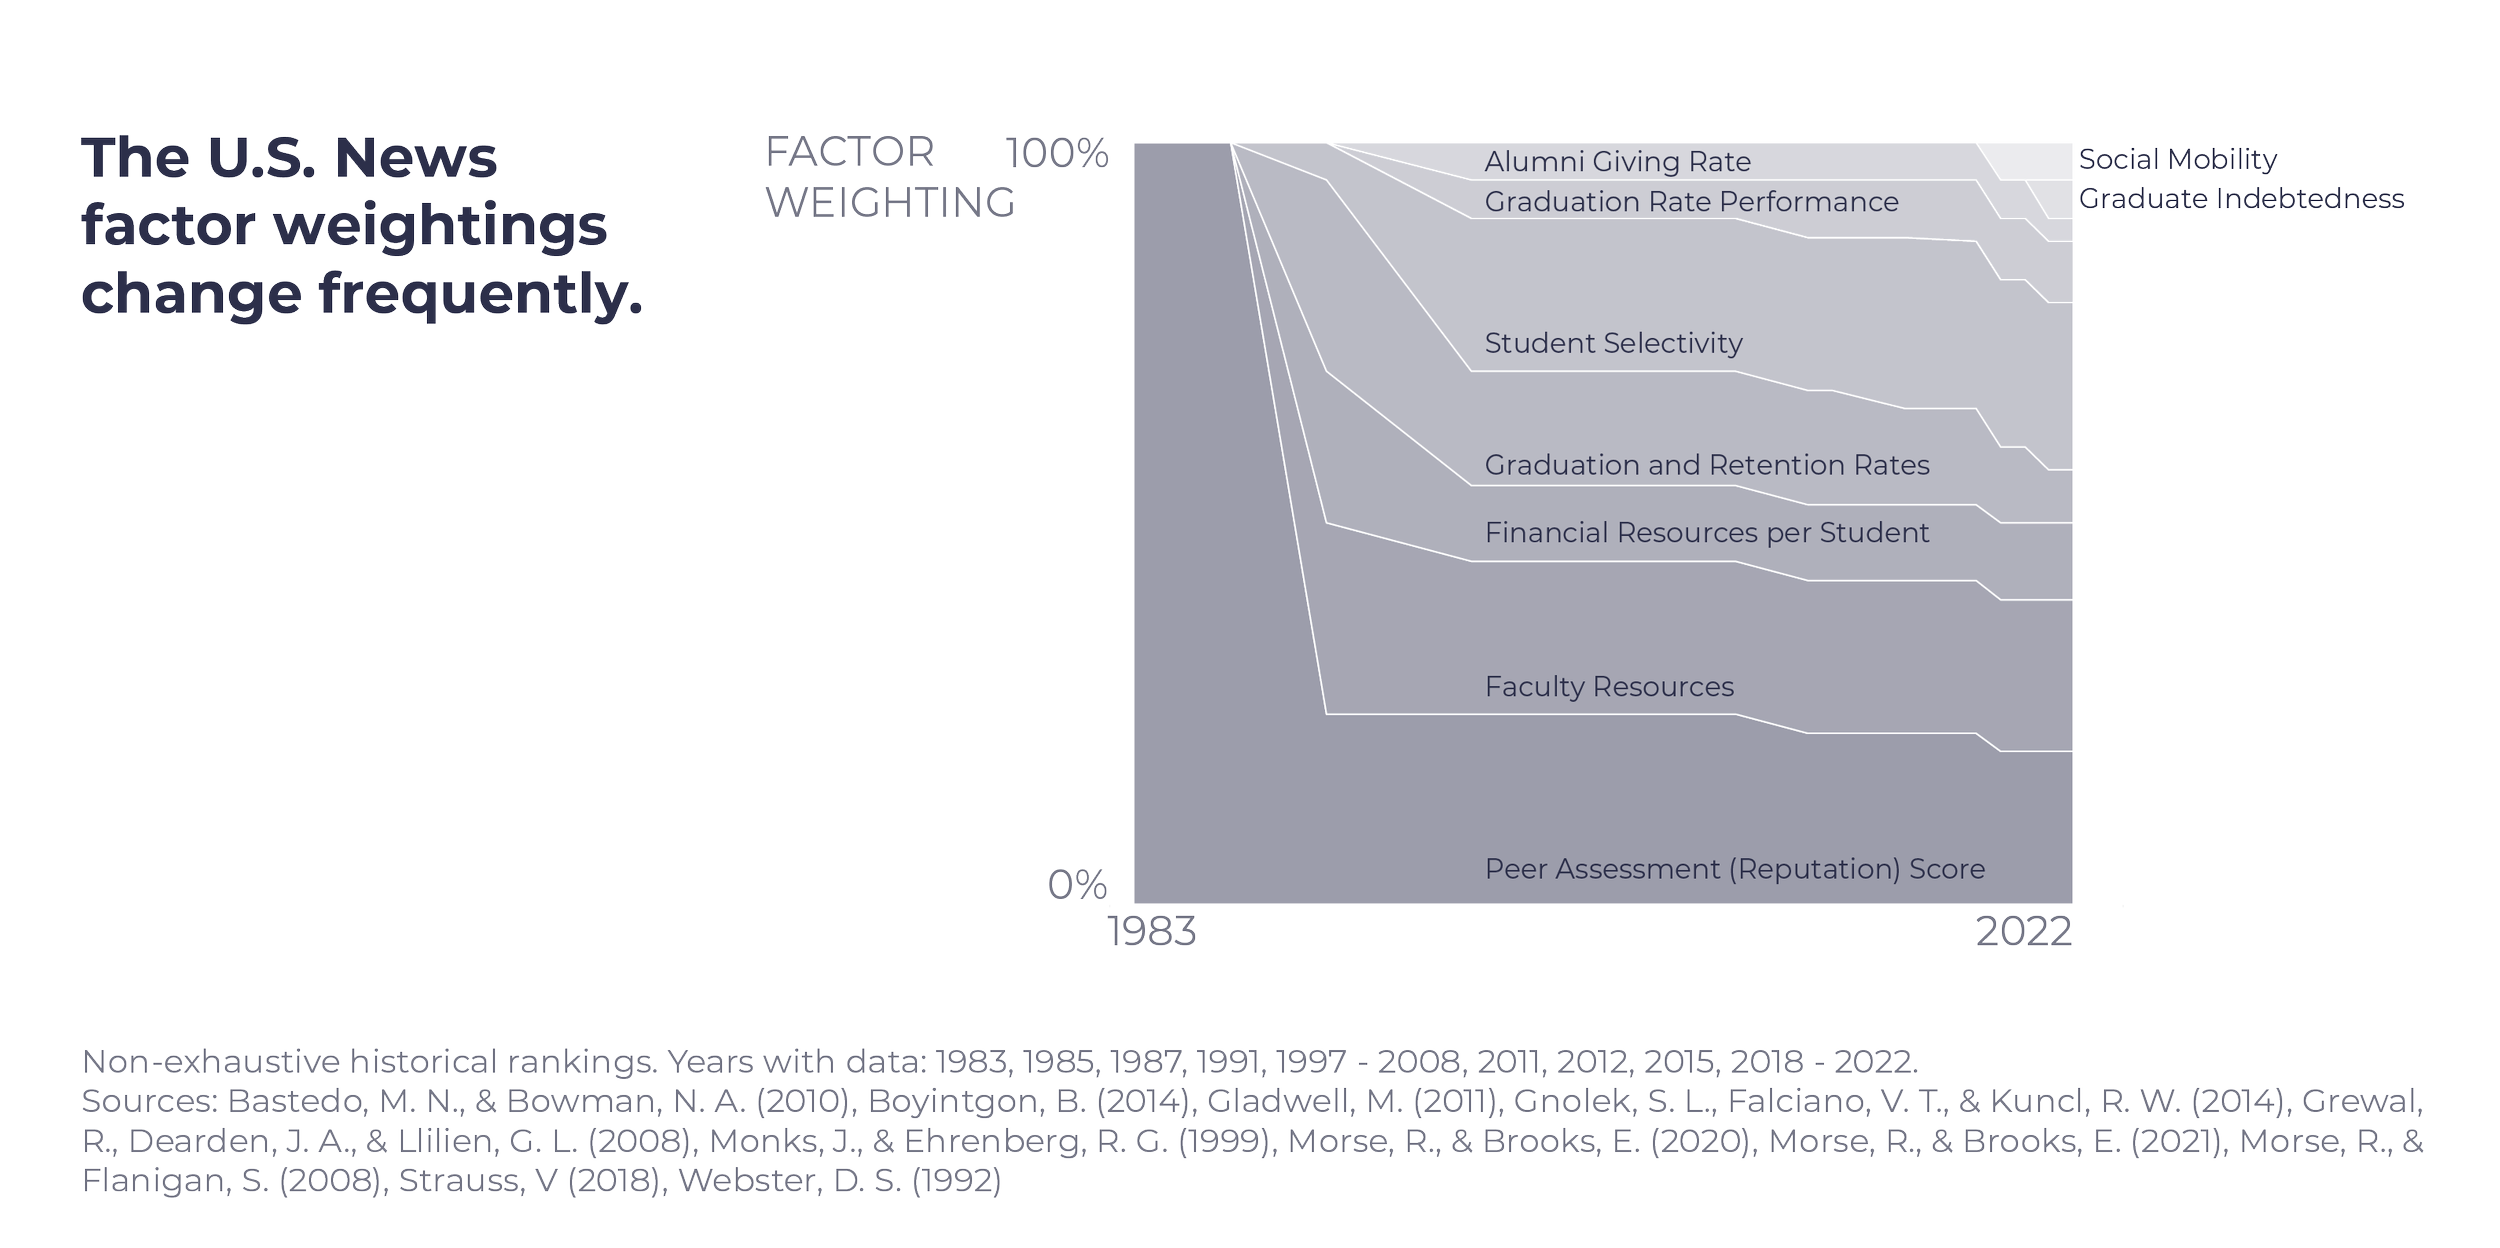
The U.S. News Best College rankings were first published in 1983, when they were created to compete with Time and Newsweek, competitors that have all but disappeared today. The first rankings included 25 national universities and 25 national colleges, and the rankings were developed based solely on a "marketing survey that asked college presidents to rate the nation's top schools." (Paterno, 2021). President emeritus of Northeastern University, Richard Freeland, shared that, "Most of the people who were filling out those surveys had no idea what they were talking about." (Paterno, 2021)
In 1988, U.S. News introduced quantitative measures into the rankings, and those have changed almost annually since (Bastedo & Bowman, 2010). From an initial weighting of 100%, the Peer Assessment (Reputation) Score is now weighted at only 20% — though this remains the most heavily weighted individual factor, and one that receives a lot of scrutiny. One reason for this is that over time, the "U.S. News rankings [have] become college reputation" (Bastedo & Bowman, 2010) — some have gone so far as to suggest that the people completing the survey use the prior year rankings to complete the survey.
The rankings, aimed at consumers, were first placed online in 1993. Over the years the rankings have expanded to include more colleges and universities (over 200 in some categories) in each category, and more categories (national universities, national liberal arts colleges, regional universities, regional colleges, undergraduate business programs, and so on). U.S. News has even expanded to ranking elementary and middle schools this year.
This expansion speaks to the business of the rankings: more lists means more press, more hits online, and more ways to make money through the paid College Compass subscription. College is a "high-stakes economic and social transaction" (Paterno, 2021) with life-long implications; how reliable are the rankings so many use to make this choice?
The rankings don't align well with student priorities.
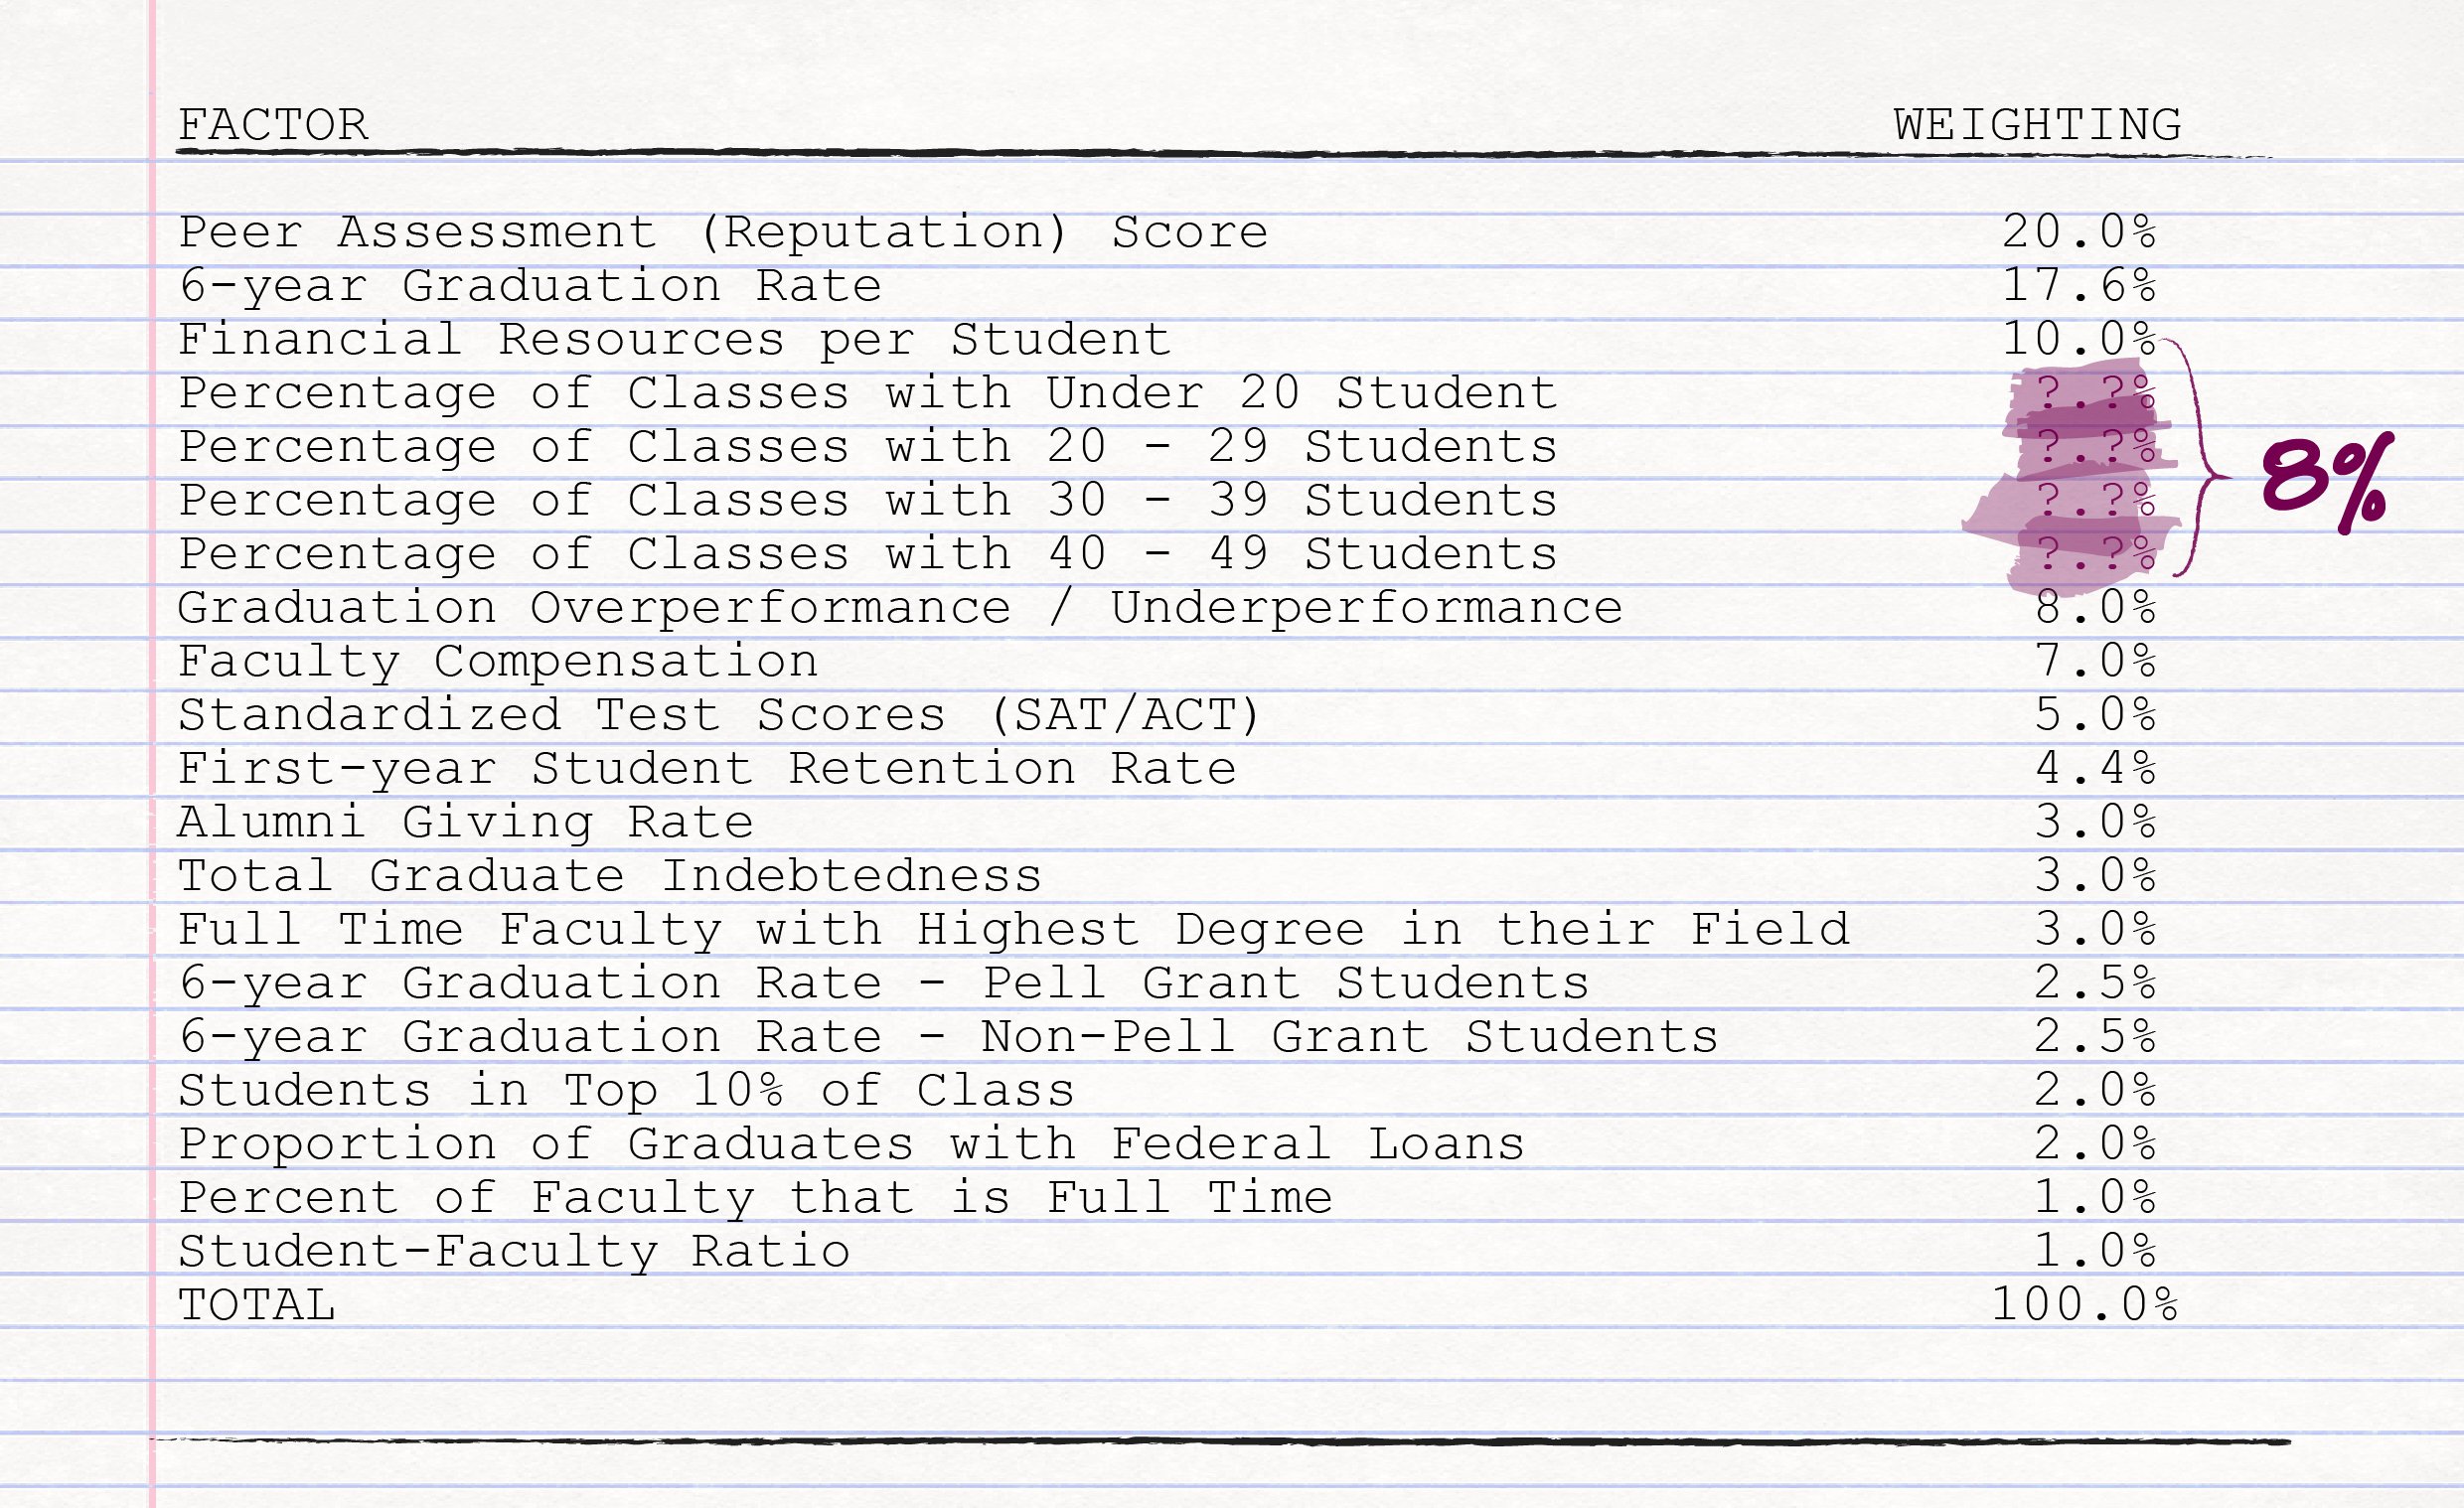
U.S. News includes 17 "factors" in its Best College rankings calculations, many of which are financially oriented.
There is limited overlap between what U.S. News factors into the rankings and what students applying to college care about:
- Reputation is measured by U.S. News through a "Peer Assessment Survey" of the president, provost and dean of admissions of the other schools in the list (i.e., the 200+ other schools considered Liberal Arts schools) and high school guidance counselors. Arguably, the reputation among recruiters or hiring managers would be more meaningful.
- Academic quality is indirectly measured through the four metrics in the table below.
- Affordability is indirectly measured through graduate indebtedness. Average net price would likely be a better metric.
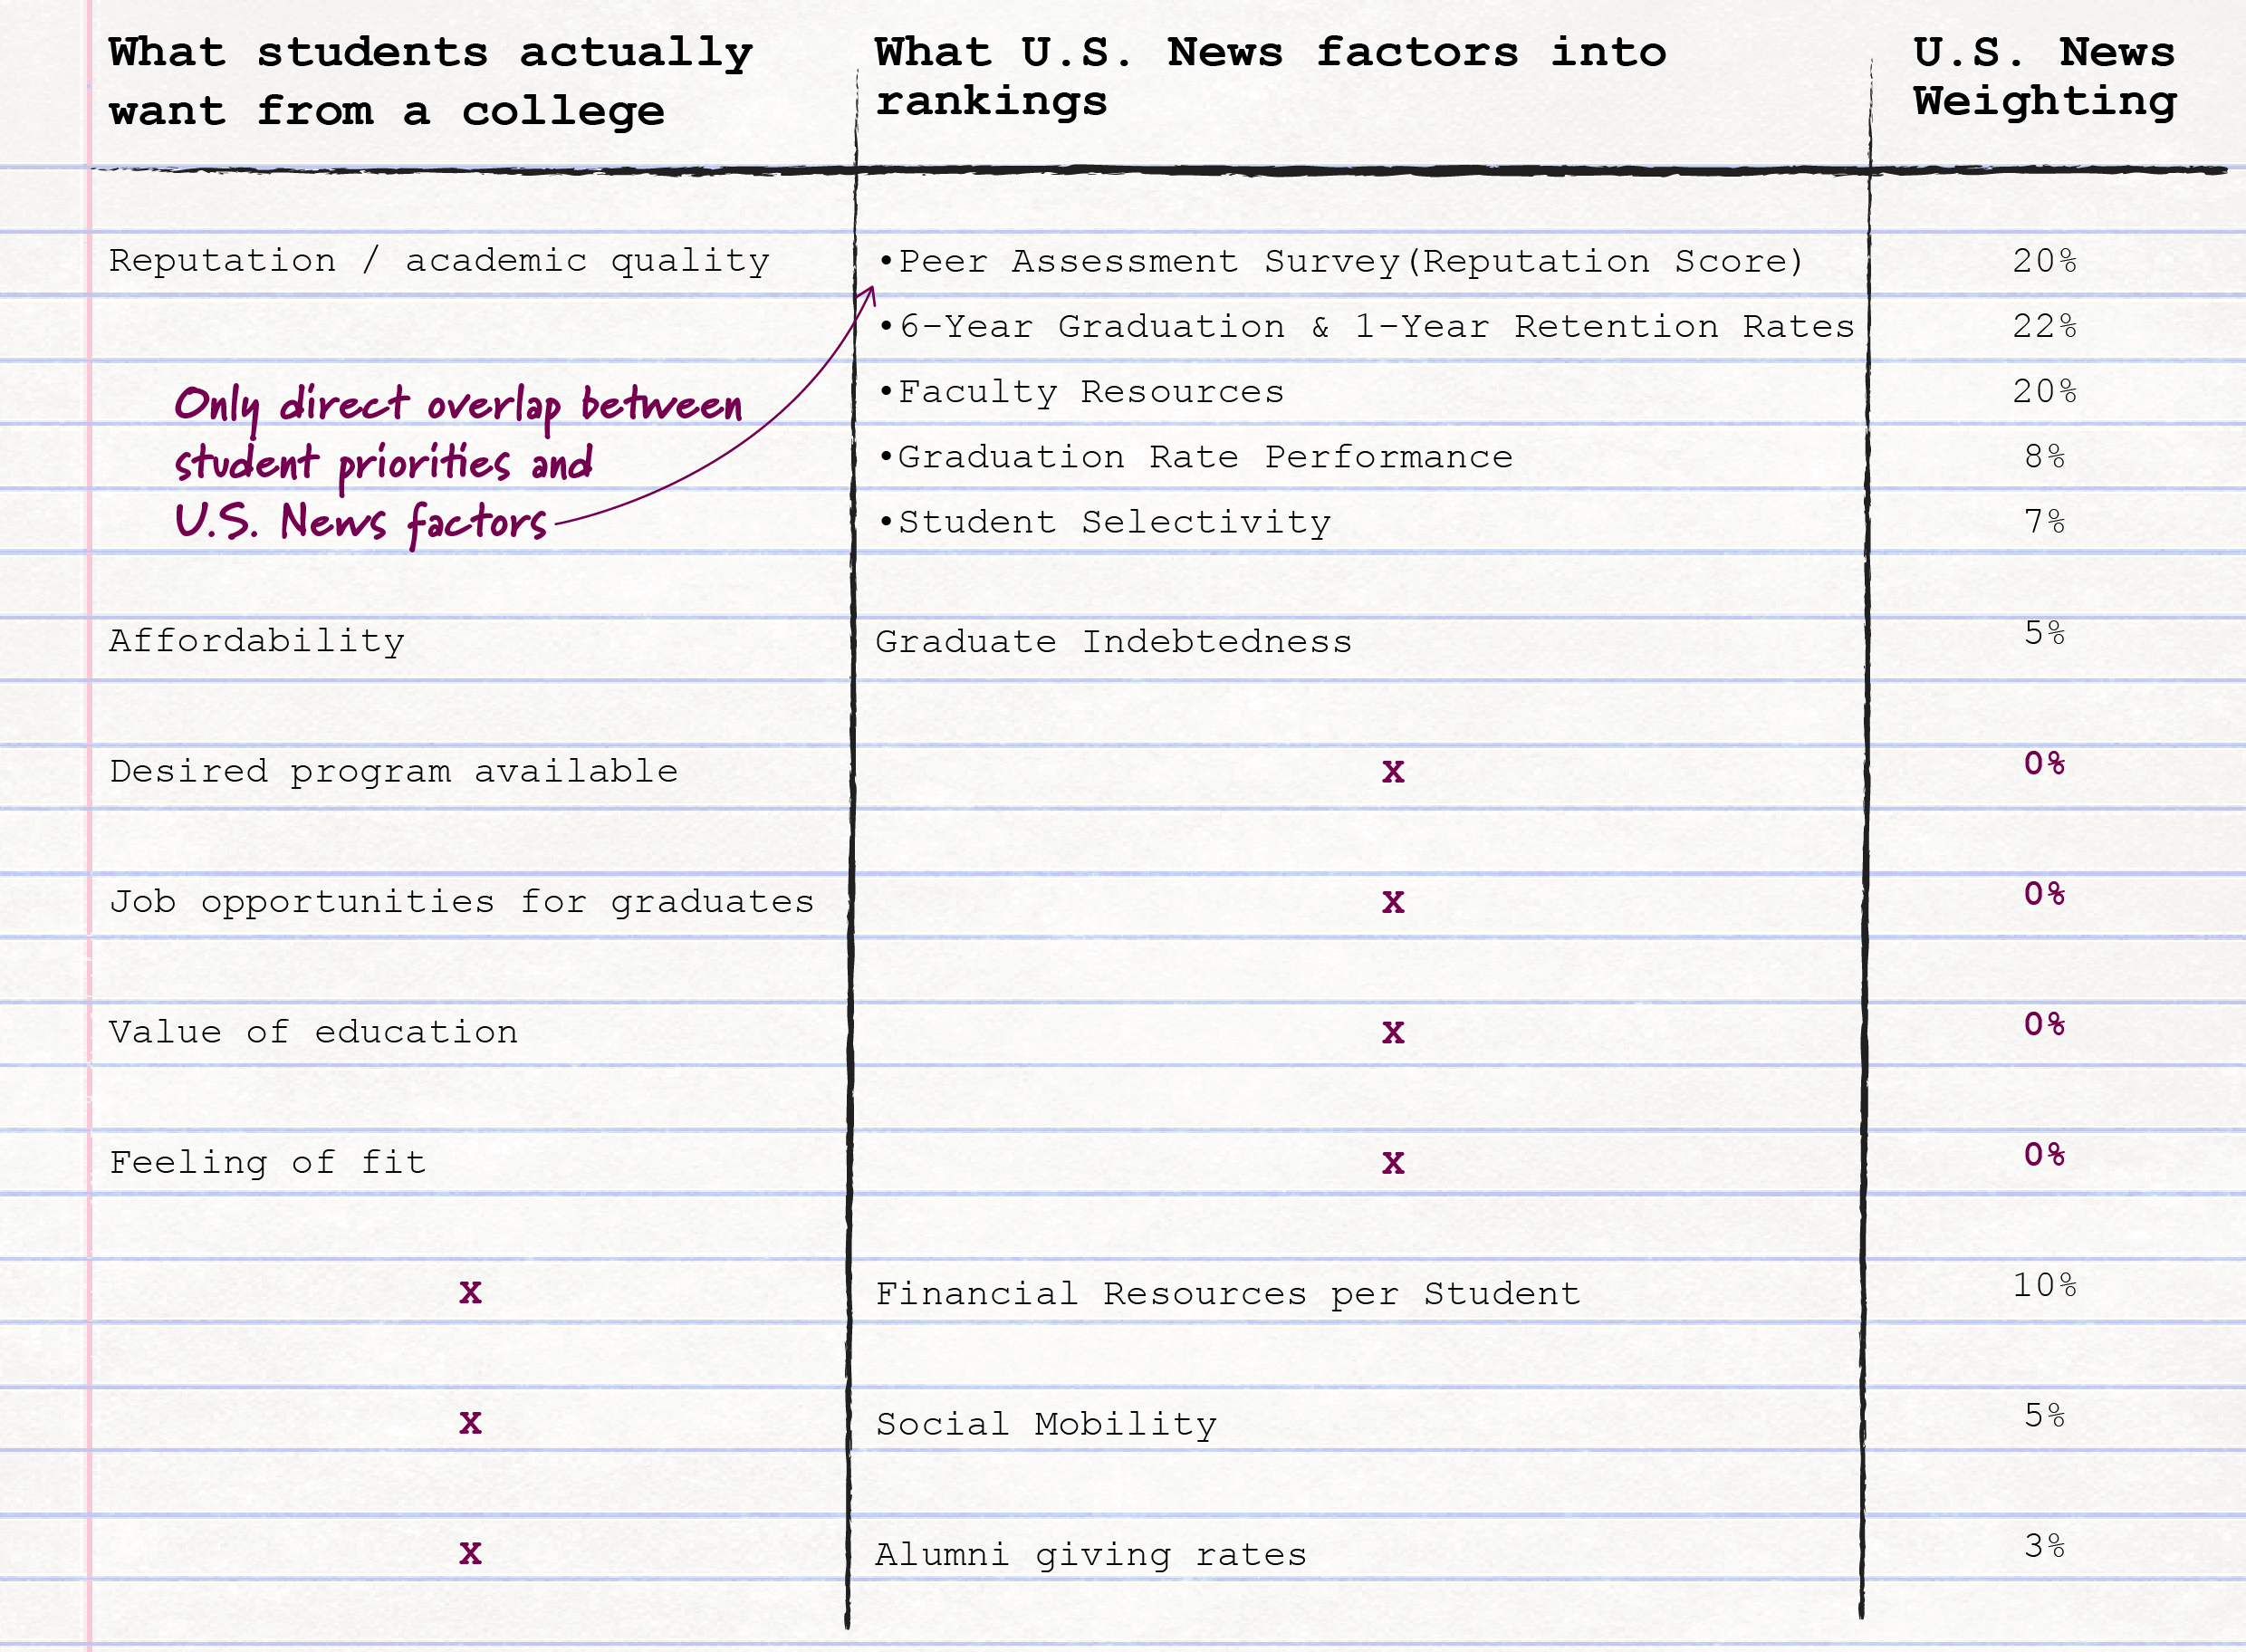
U.S. News only addresses students' concerns about reputation / academic quality and affordability, and most metrics related to this are measured indirectly. U.S. News fails to address students' other concerns, while valuing metrics that students don't seem to care about.
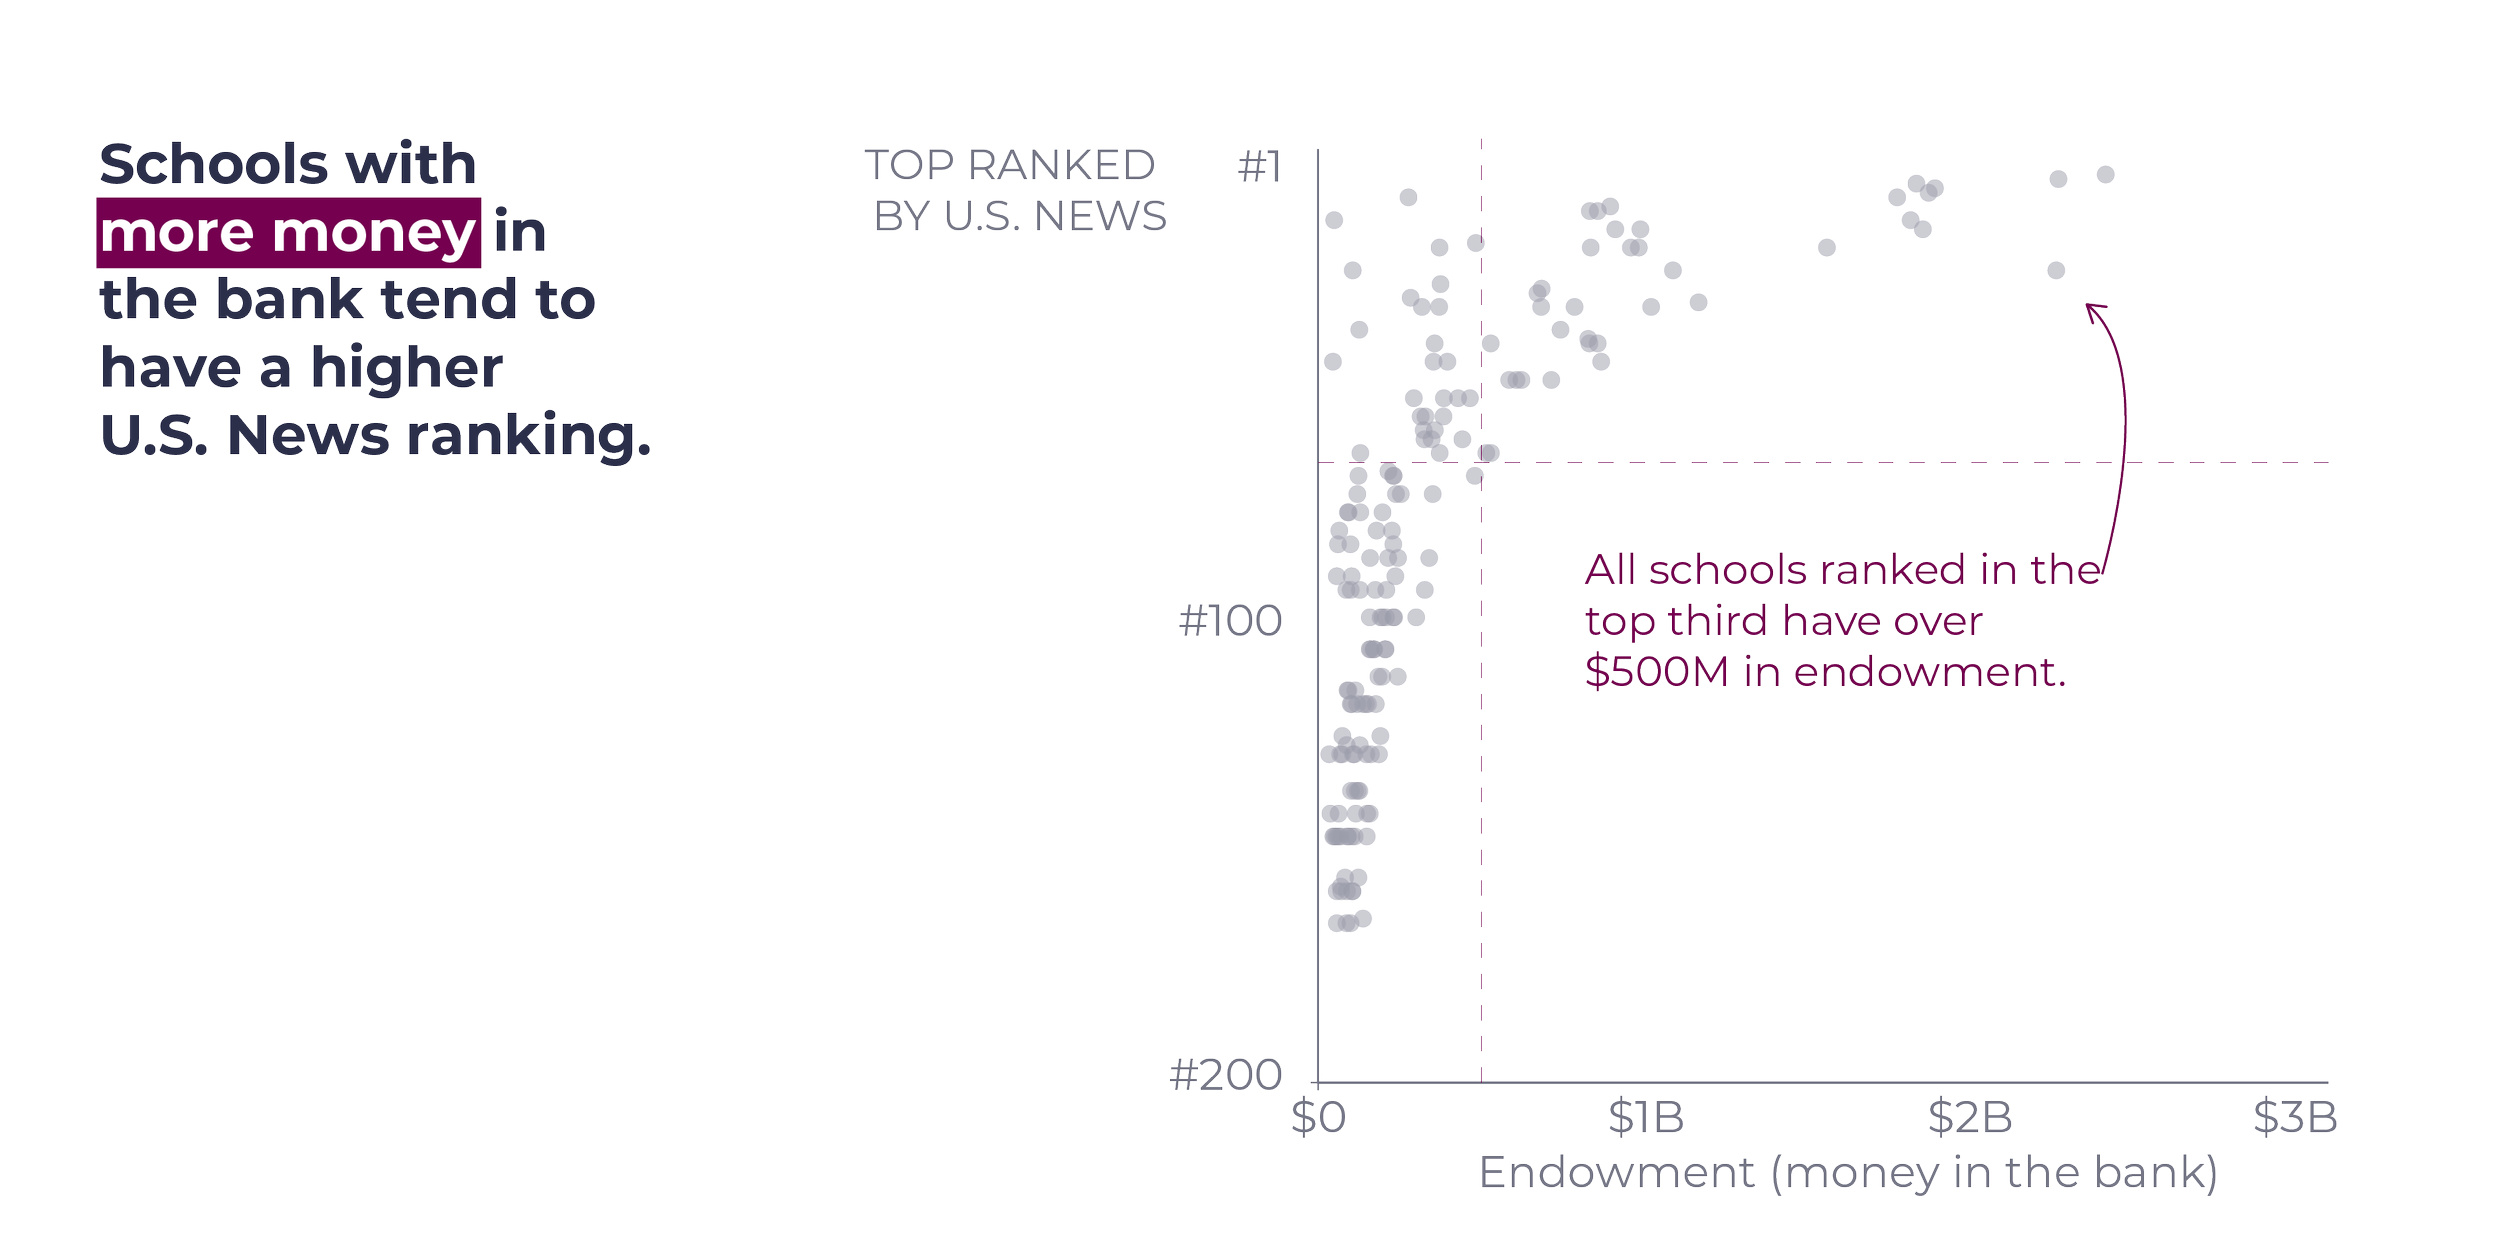
The rankings are correlated with wealthier schools and students.
Many of the metrics U.S. News incorporates into the rankings are directly or indirectly related to how much money the school and its students have:
- Graduation and retention rates (22% of the U.S. News Score) can favor wealthier students who have more resources at their disposal for tutoring and the like, and whose familial financial situation is less likely to negatively impact their ability to stay in school.
- Faculty resources (20%) is tied to a school's financial resources and financial resources per student (10%) measures a school's spending.
- Graduate indebtedness (5%) is likely to be lower if a student comes from a wealthier family, while alumni giving rate (3%) is likely to be higher for wealthier alumni.
The way the U.S. News ranking system is constructed rewards (intentionally or otherwise) schools with more money and who admit wealthier students.
In his Revisionist History podcast episode Project Dillard (about an Historically Black College or University (HBCU), Dillard University), Malcolm Gladwell describes the STEM (science, technology, engineering and mathematics) "leakiness" problem that exists at most schools:
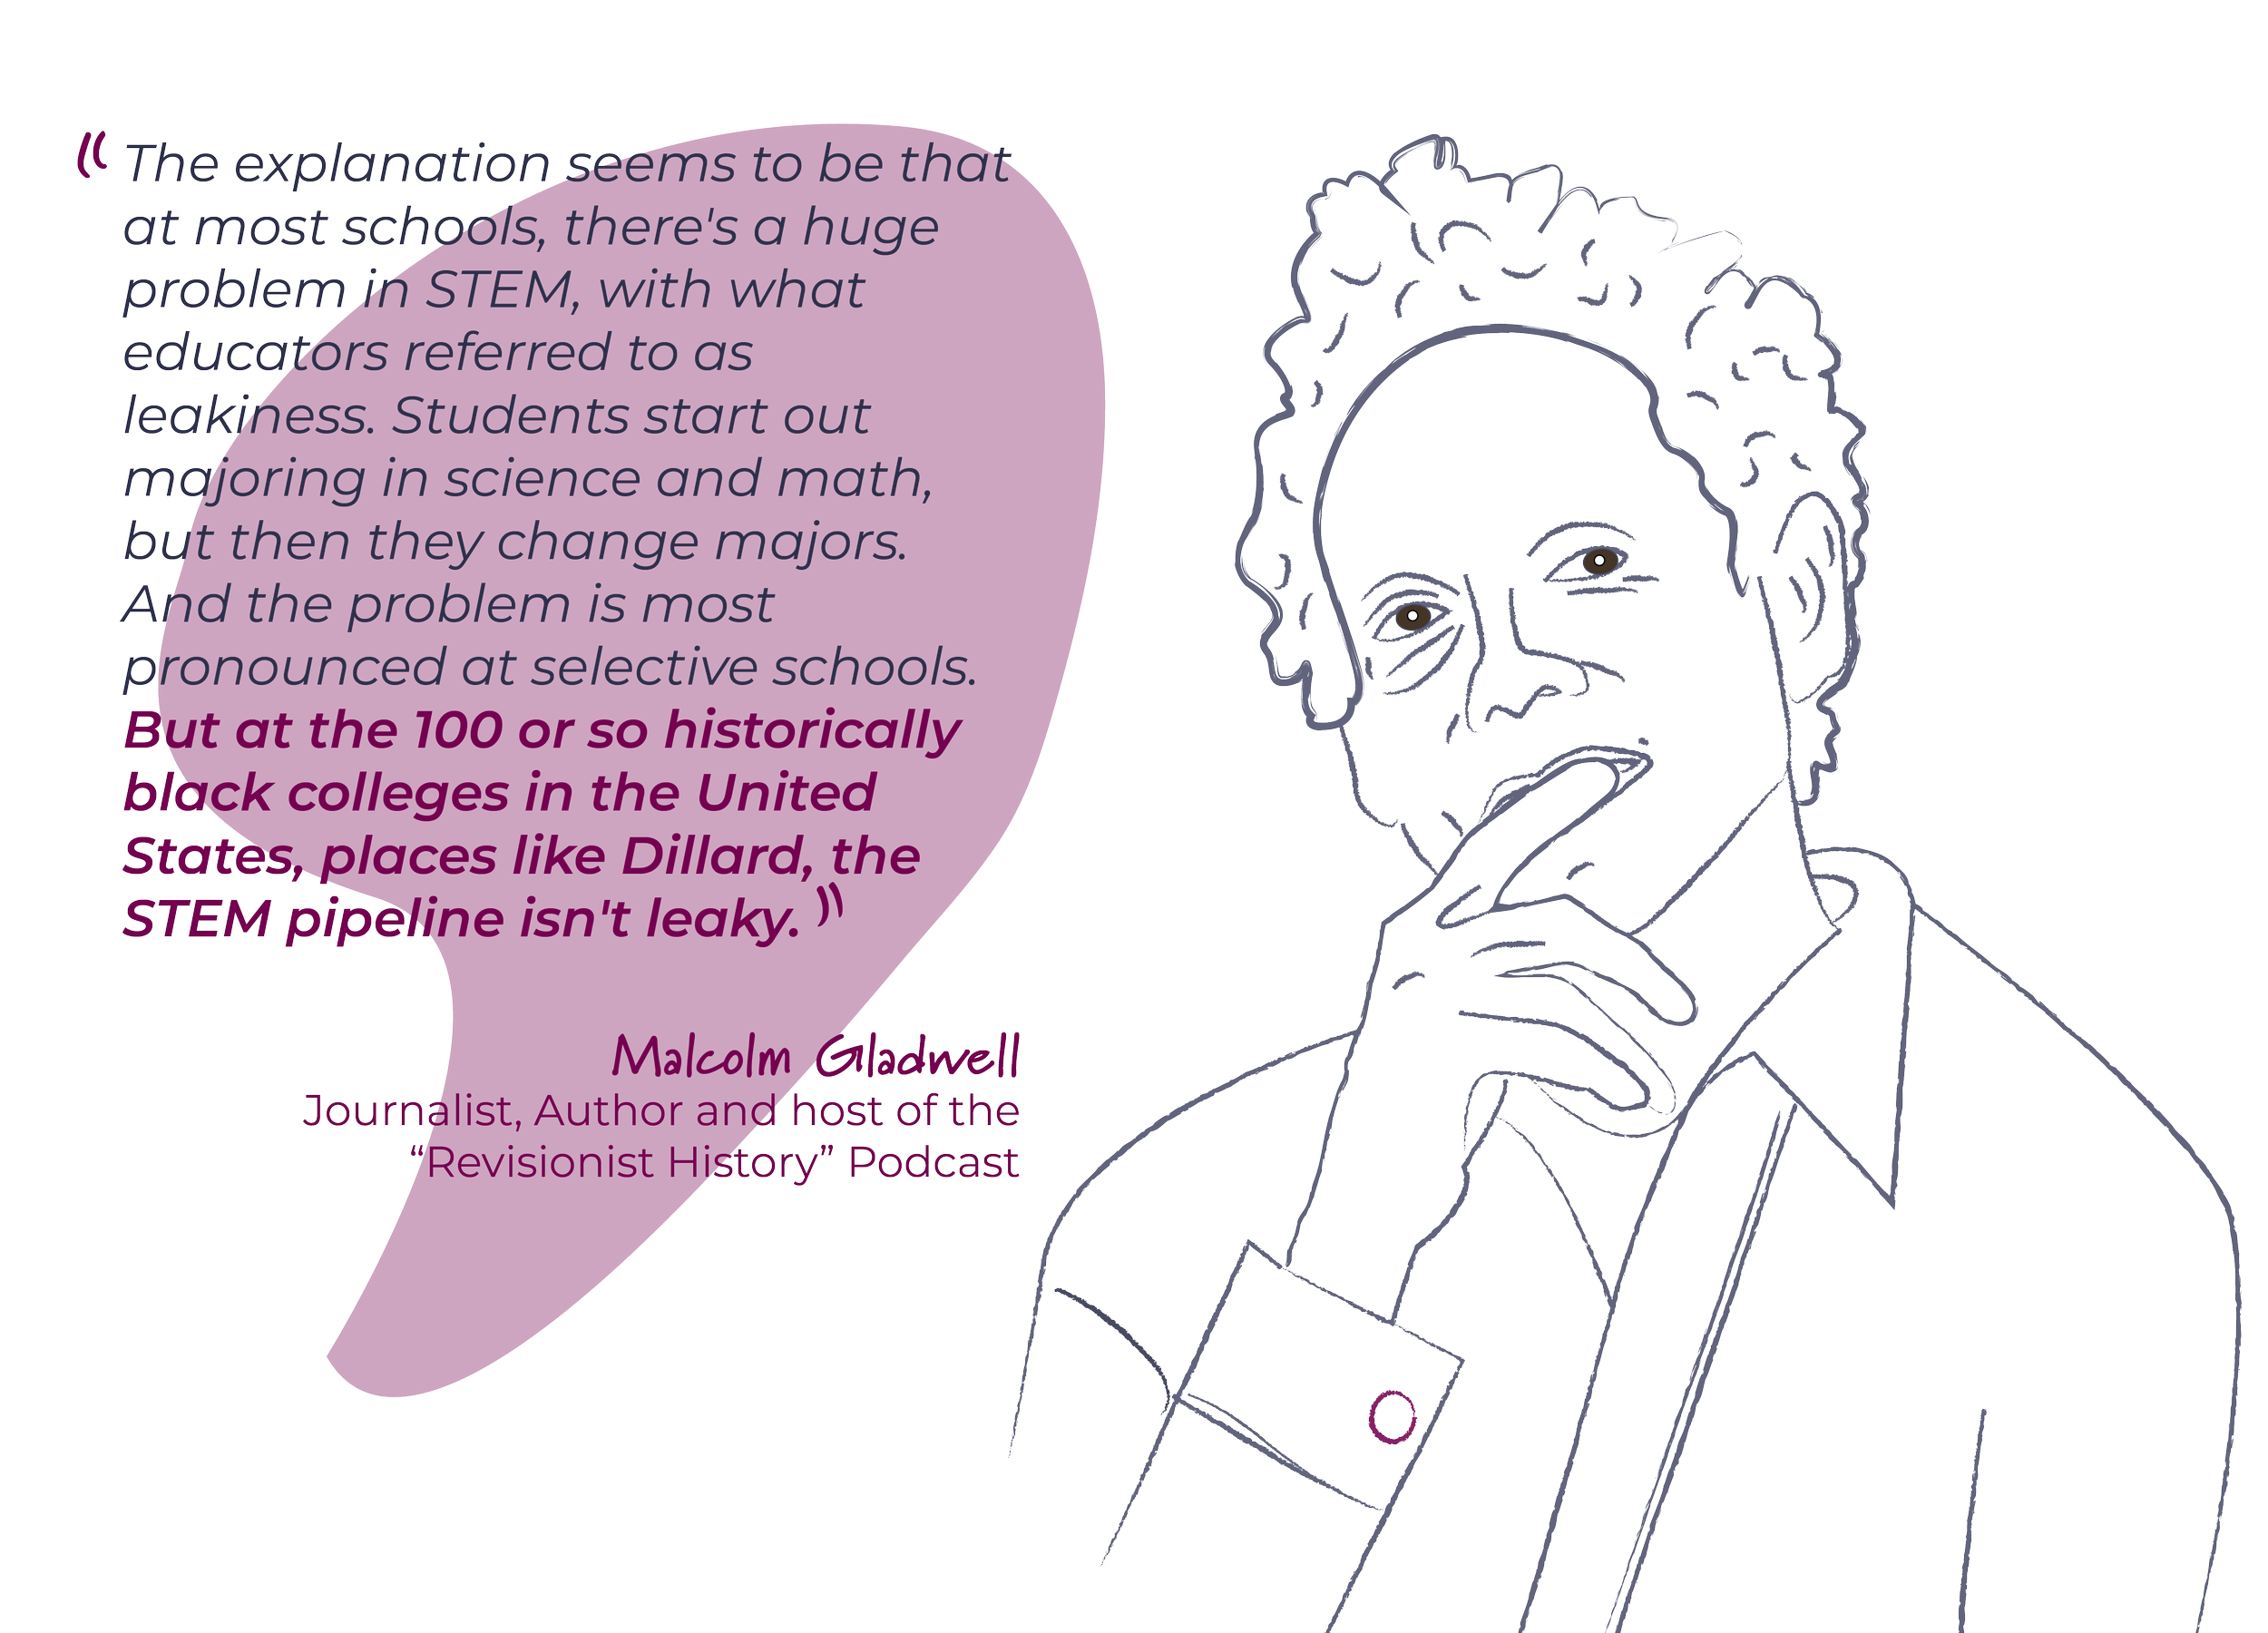
Malcolm Gladwell describing the STEM leakiness phenomenon.
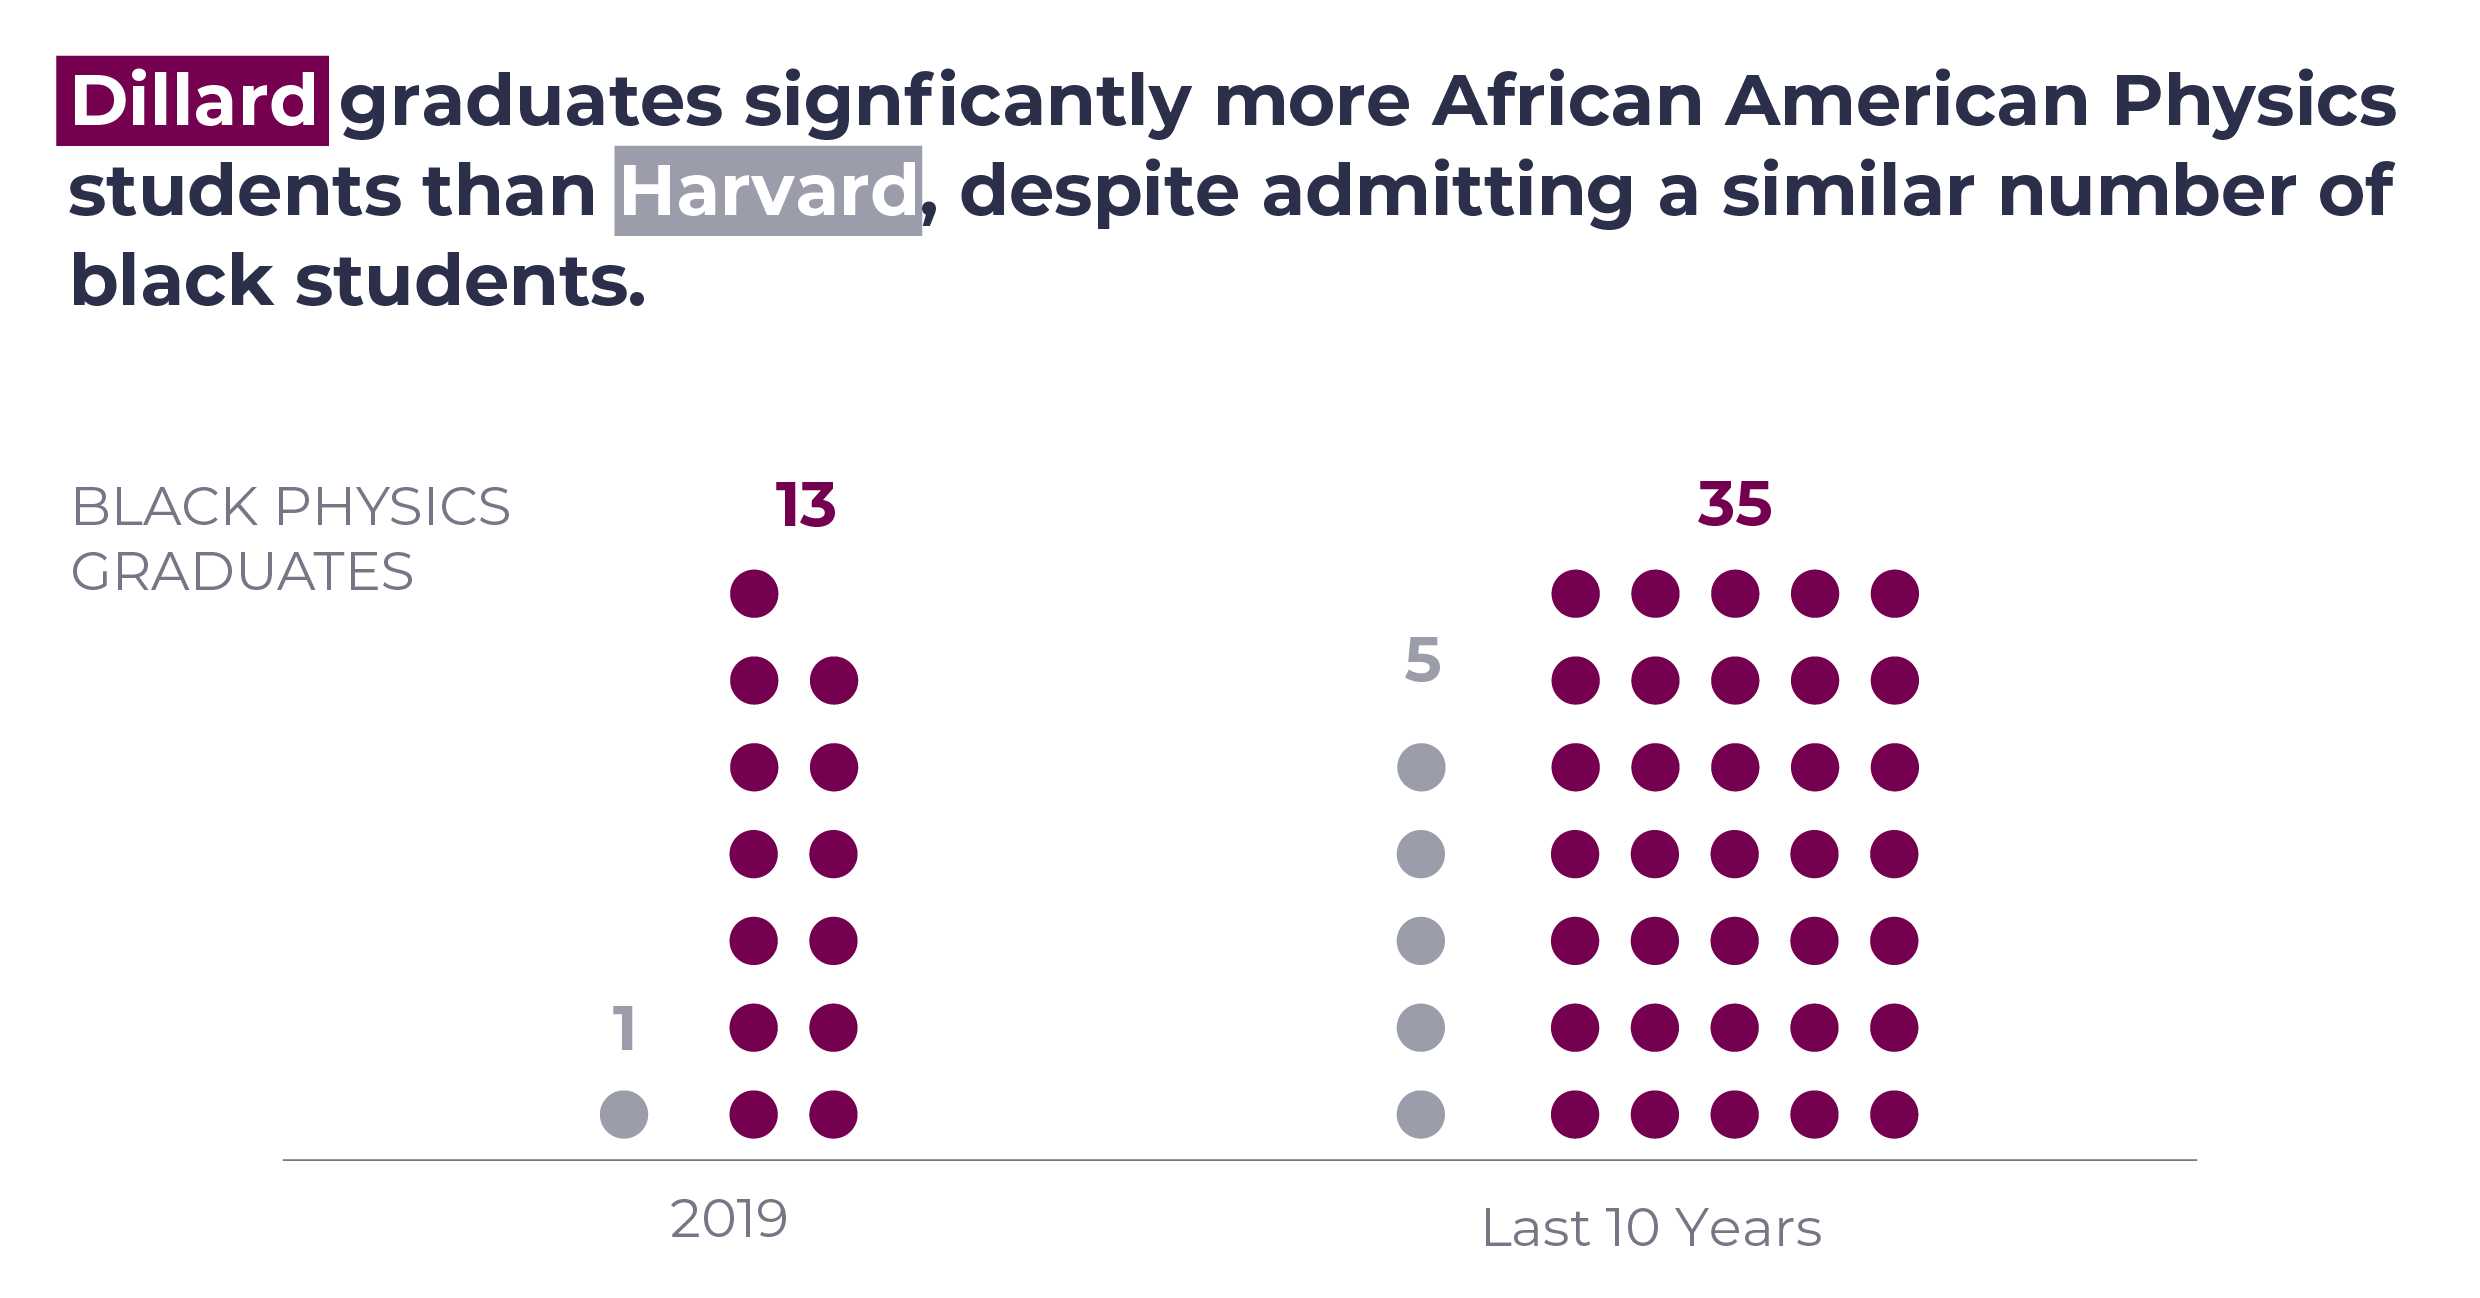
Educational researcher, Mitchell Chang, explains that students who are in these challenging STEM programs who don't make it to the top of their college classes lose their confidence and abandon their pursuit of a STEM degree. However, HBCUs, compared to more selective institutions, are more focused on helping their students succeed in STEM programs.

Mitchell Chang about how HBCUs combat STEM (science, technology, engineering and math) leakiness (when students enter into a college as STEM majors but ultimately "drop out" of those majors because they are "too hard.")
Despite providing excellent education at a great value, HBCUs are for the most part excluded from the U.S. News Best Colleges list. Only four HBCUs made it into U.S. News' Best Liberal Arts Colleges ranking since 1983.

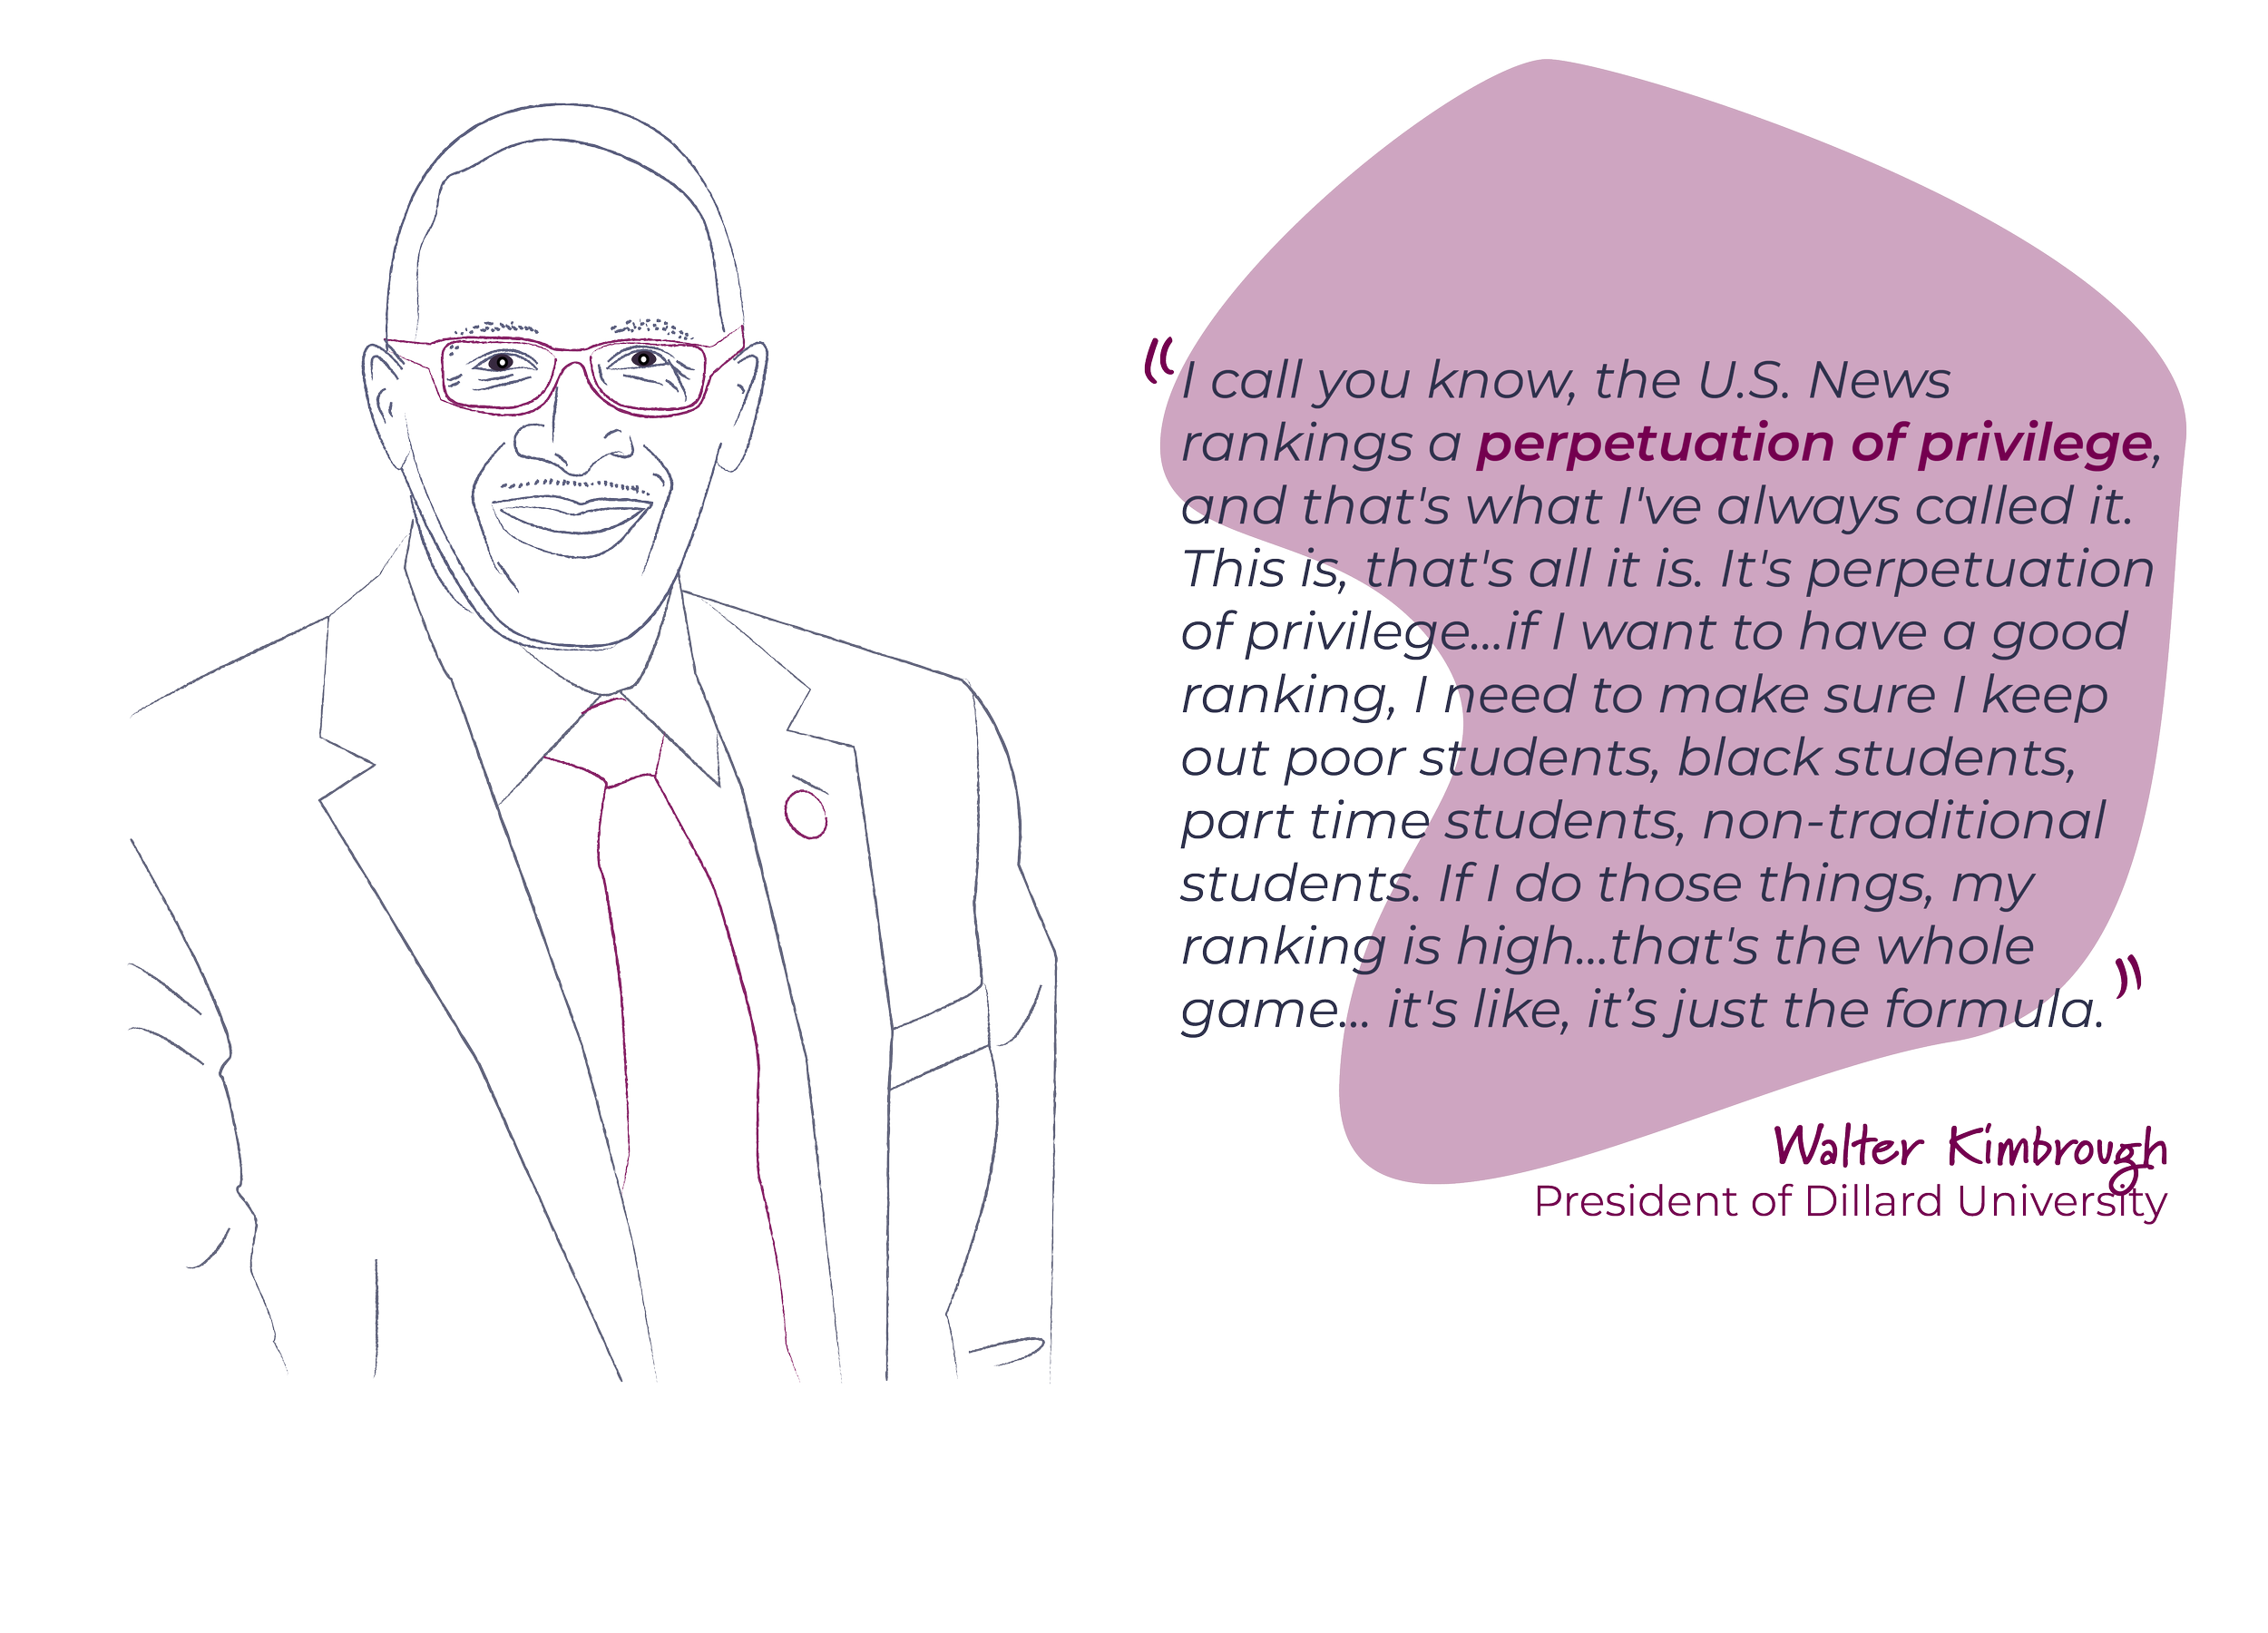
Walter Kimbrough about the biases inherent in the U.S. News Best College rankings and how they impact colleges that serve underprivileged communities.
The rankings and data are not transparent.
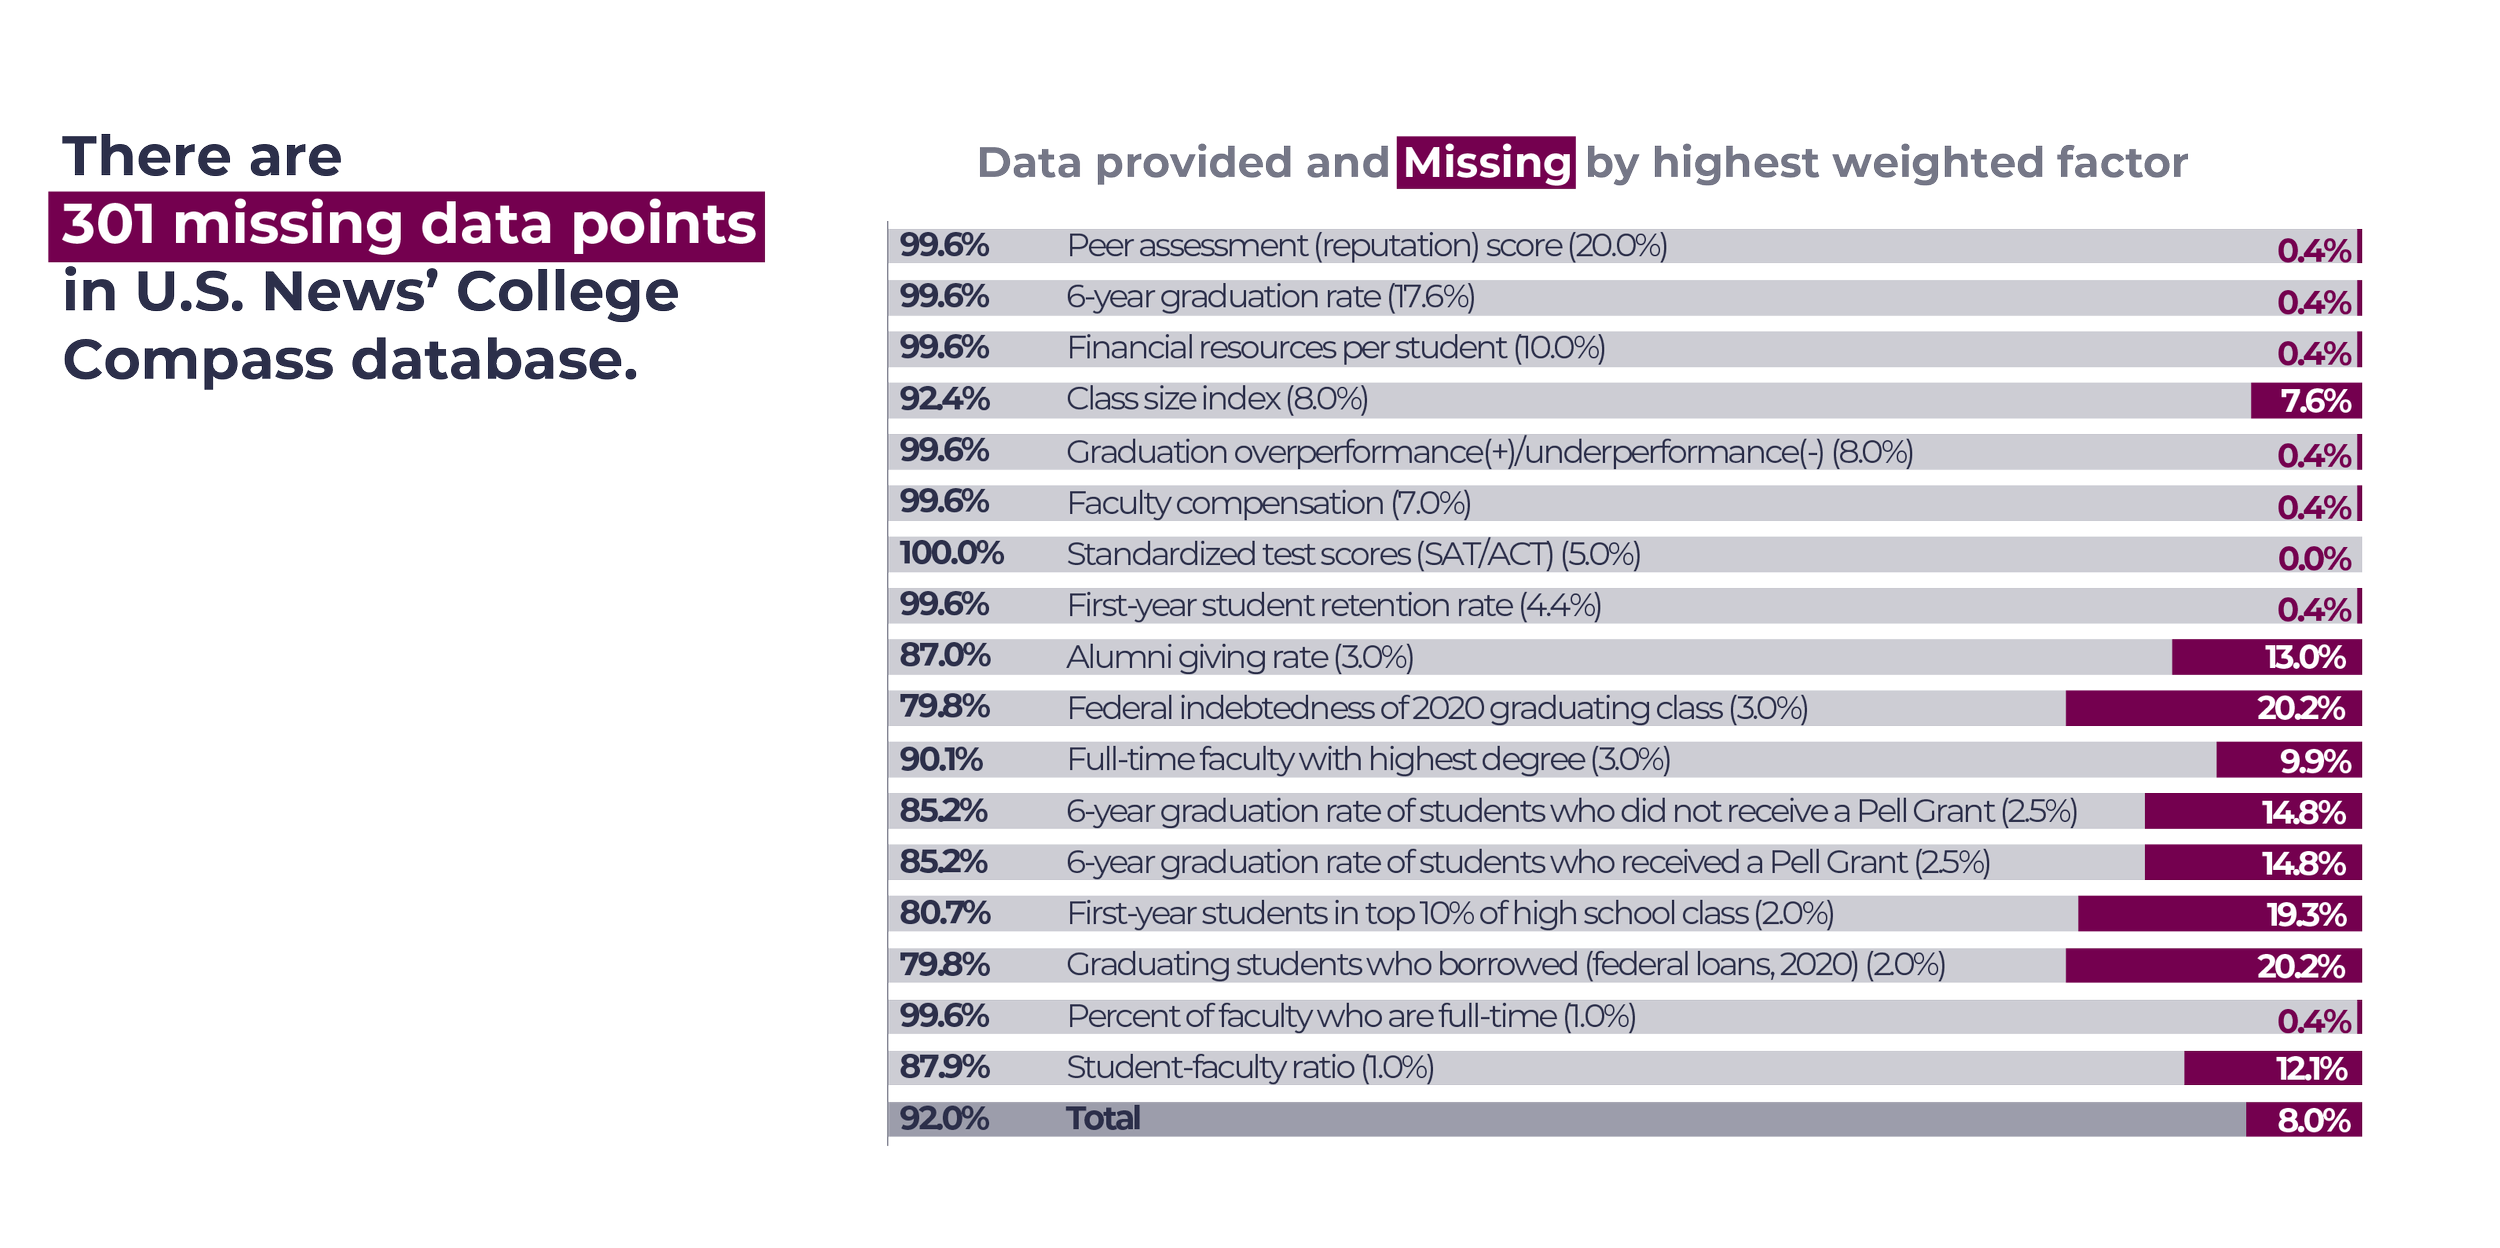
U.S. News portrays itself as being transparent, releasing an article with the rankings each year describing "A More Detailed Look at the Ranking Factors." Despite this detail, there are gaps in the data.
The factor weightings are not fully transparent.
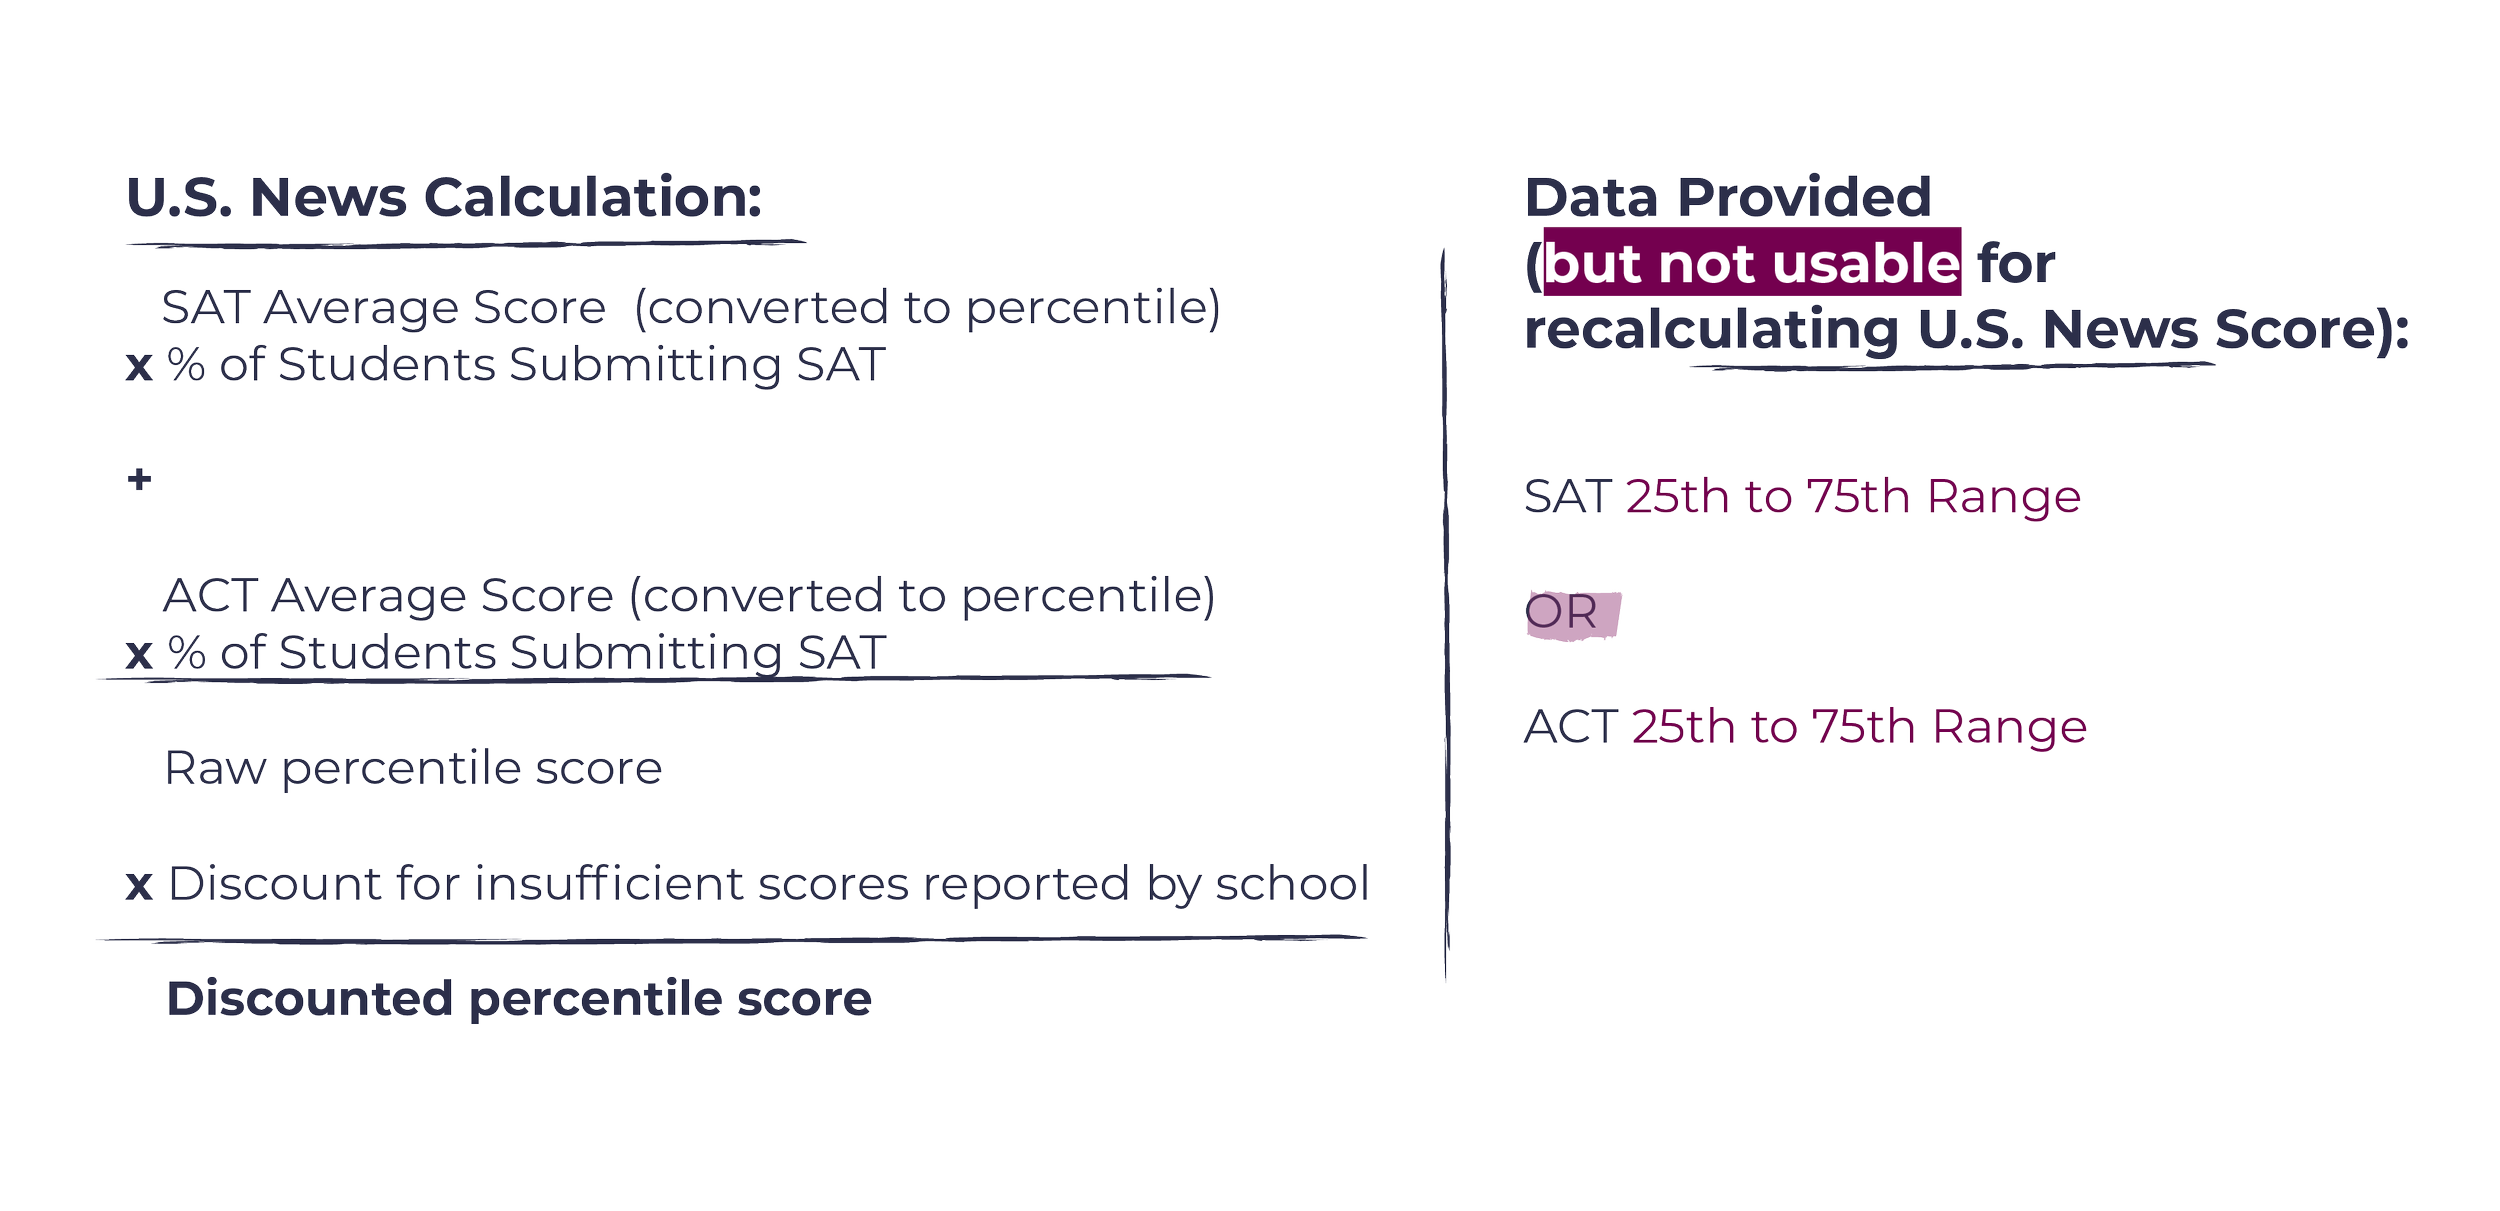
U.S. News presents a table of the factor weightings, but the descriptions show that the full formulas are still hidden.
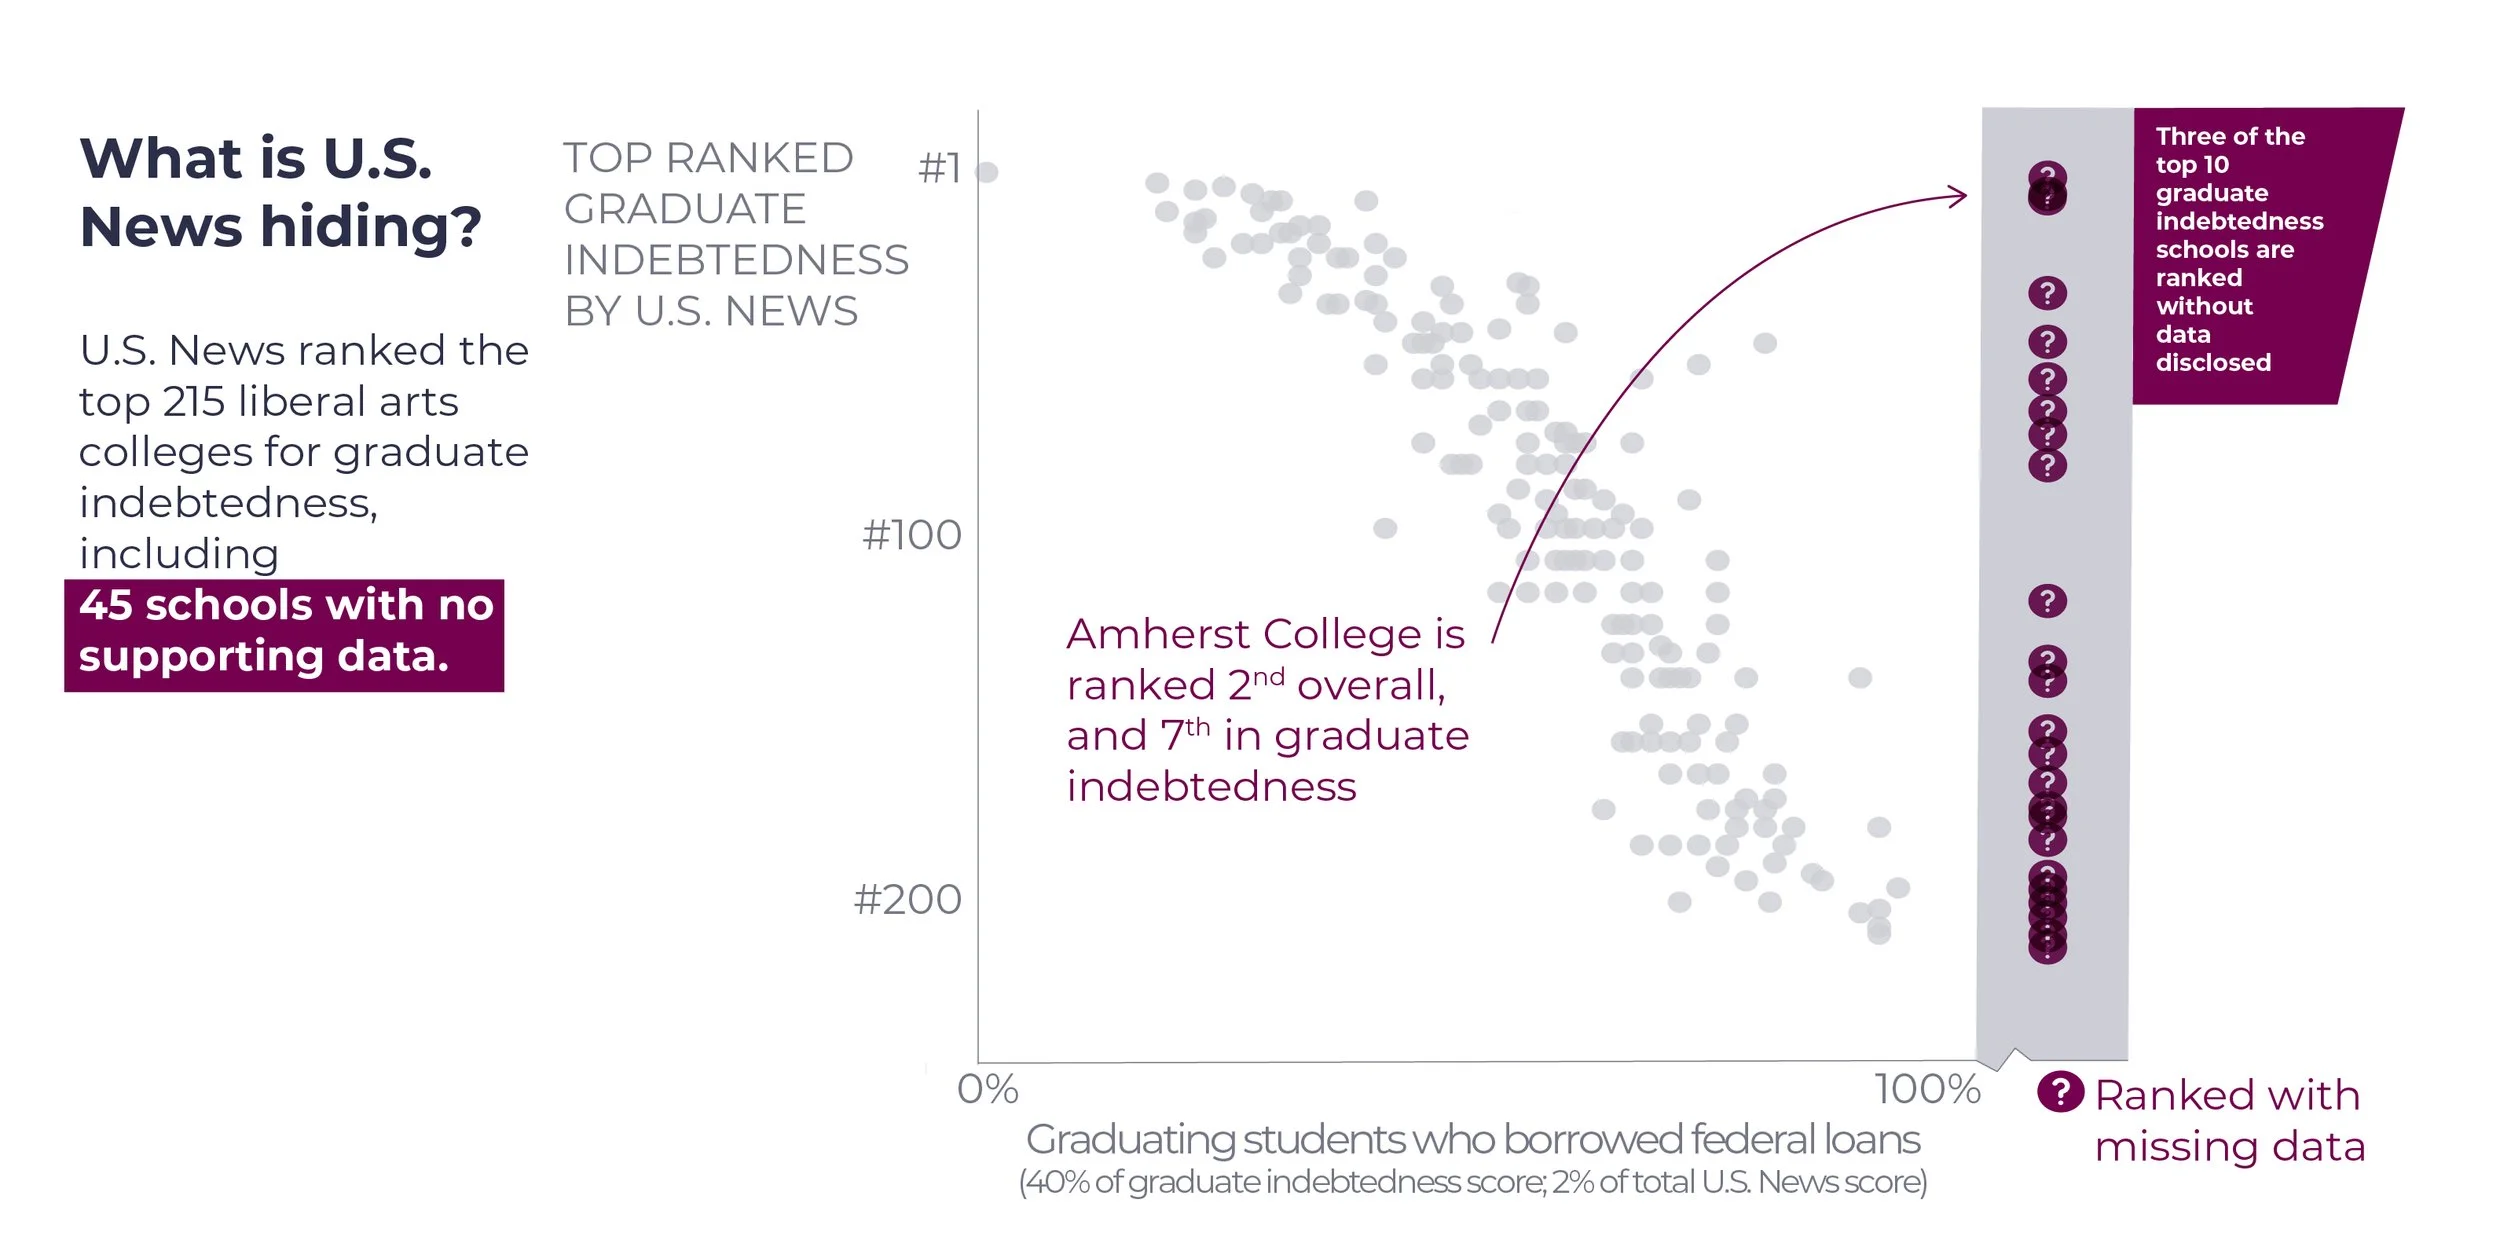
U.S. News does not disclose all of the data used to calculate the rankings.
The rankings have suspicious trends.

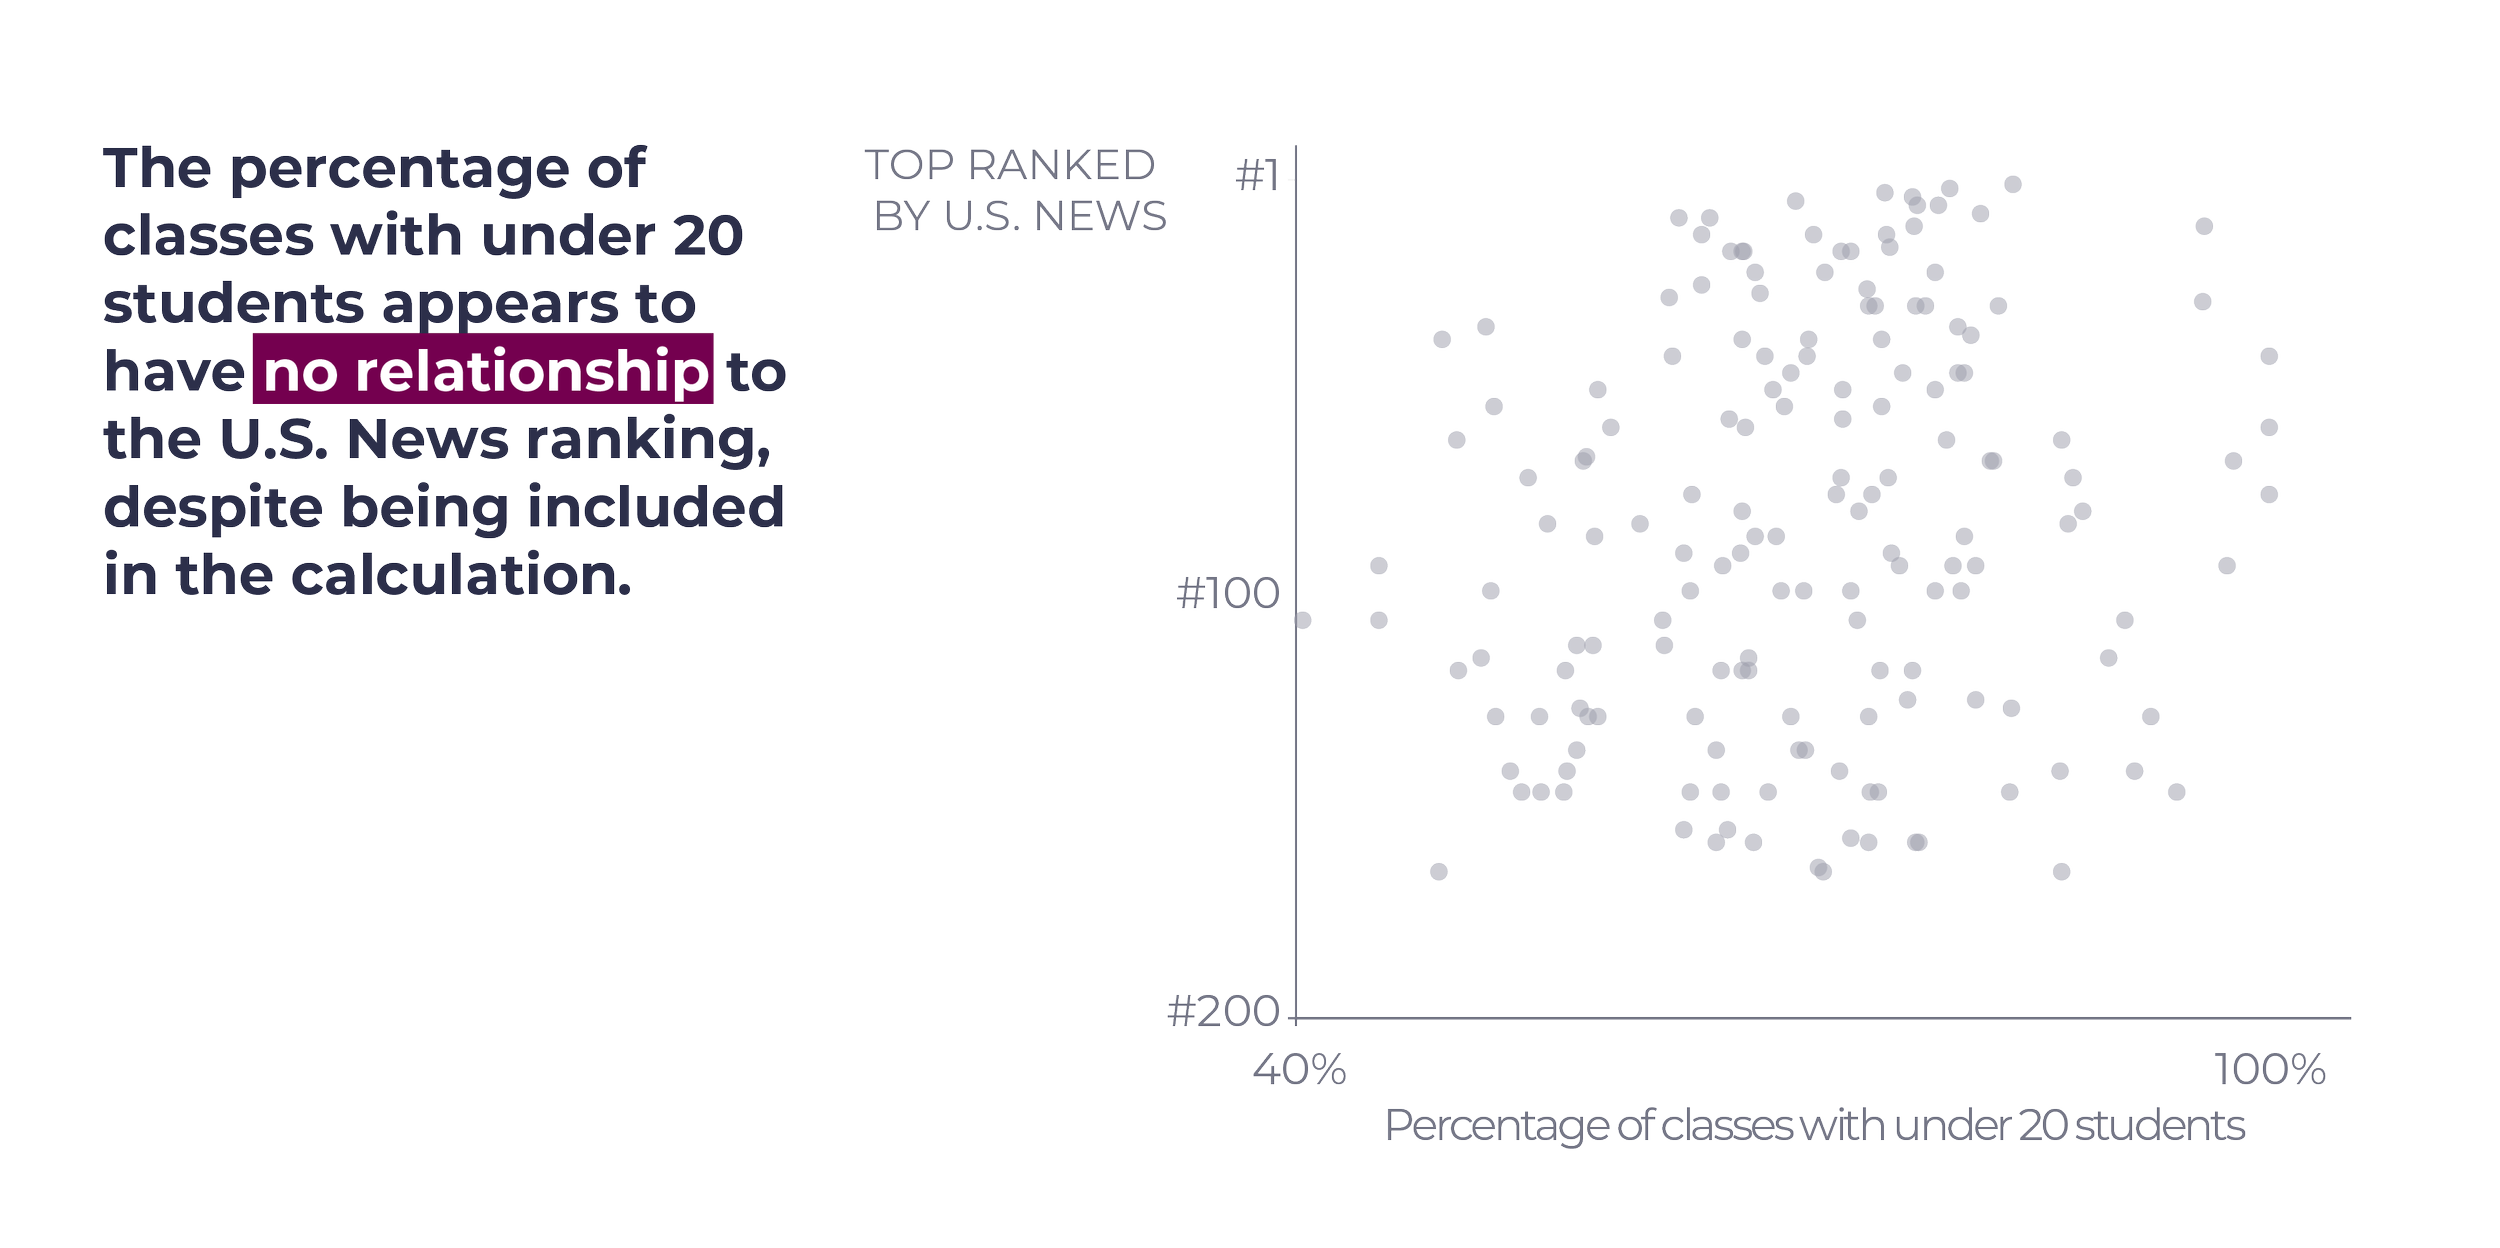

Is more always better than less? It depends what the "more" is.
All ranking systems are inherently biased; by definition, they must incorporate judgment about what matters, and what matters most. As users we need to decide whether we agree with those judgment calls and should consider holding organizations, like U.S. News, accountable for providing transparency behind their data.
U.S. News has decided that reputation and financials matter most, though it is all reported under the guise of academic quality.
When asked what is the basis for the assumption that the more money a school has, the better quality of the education, Robert Morse, chief data strategist for U.S. News and the man in charge of the rankings, replied:

Robert Morse about why U.S. News includes financially oriented factors in its best college rankings.
How to do better
U.S. News can increase transparency and do more diligence to ensure accuracy and reliability of self-reported data.
Colleges can also refocus their efforts and resources on fulfilling their missions and serving students rather than prioritizing the rankings.
Perhaps most importantly, students and parents can start with a blank sheet of paper and think about what is important in a college experience. Armed with a list of priorities, they can find reliable data to help them narrow down the list of schools. One such source is the government survey data available through IPEDS.
There are also other ranking systems that may be better aligned with student and parent priorities or are more direct about what is being measured:
- Academic Influence ranks schools based on their belief that influential graduates are the best marker of a quality education.
- Forbes believes that "schools that do an especially good job of reaching out to lower-income students, kids denied the benefits of first-rate suburban or private high schools, summer camps, tutors, etc., should be recognized when they promote economic and social mobility" (Vedder, 2021) and incorporates this into their ranking system, which is "based on outcomes, not reputation and test scores."
- Niche is a ranking system that includes student feedback alongside the quantitative data (from sources such as the U.S. Department of Education).